The share of Americans who claim no particular religion doubled from 7% to 14% in the 1990s, as sociologists Michael Hout and Claude Fischer reported in an influential 2002 article based on the General Social Survey. A decade later, the Pew Research Center found that one-in-five U.S. adults (and fully a third of those ages 18-30) have no religious affiliation. Despite the rapid growth of the unaffiliated, Gallup editor Frank Newport cited survey data in a recent book to explain why he thinks “God is alive and well” in the United States. These findings raise many questions, including: What are the reasons for the rise of the religiously unaffiliated? Can organized religion thrive in the United States if growing numbers claim no religion? Is America, as a whole, becoming less religious or more religious? And how different, religiously, is the millennial generation from baby boomers and other recent generations?
On Aug. 8, 2013, the Pew Research Center brought together some of the leading experts in survey research on religion in the U.S. for a round-table discussion with journalists, scholars and other stakeholders on the rise of the religious “nones” and other important trends in American religion. The edited transcript is below.
Speakers: Claude Fischer, Professor of Sociology, University of California, Berkeley Michael Hout, Professor of Sociology, New York University Frank Newport, Editor-in-Chief, Gallup Greg Smith, Director of U.S. Religion Surveys, Pew Research Center, Religion & Public Life Project
Moderator: Alan Cooperman, Deputy Director, Pew Research Center, Religion & Public Life Project
Audio and Slides: You can find a recording of the event as well as all the slides on Audio and Slides: Religion Trends in the U.S..

[& Public Life]
Now, you have the speakers’ biographies in front of you in the packets, so I won’t go into great detail, but because scholars and journalists are sometimes less familiar with each other than they should be – and because one of the purposes of these luncheons is to bring the two communities together – I will say what everyone in the academy already knows, which is that professors Michael Hout of New York University and Claude Fischer of the University of California at Berkeley have had a very great impact on the field of the sociology of religion in the United States. One of their seminal papers way back in 2002 in the American Sociological Review noted a sharp rise in the percentage of Americans who do not identify in surveys with any particular religion. The size of that group, sometimes colloquially called the “nones” – N-O-N-E-S – had at that time doubled from about 7% to about 14% of the U.S. public, and in all of our surveys – in GSS, in Gallup and in Pew Research surveys – those numbers have continued since then to climb. Mike and Claude, in their paper, very persuasively, I think, showed that the increase in the size of this religiously unaffiliated population had both a generational component and a political component, and they offered the hypothesis that politics might actually be one of the factors driving the rise of the “nones.” Now, a few months ago, Mike told us in an email that he and Claude re-examined – using the GSS and more recent data – looked deeper at the causes of growth in the unaffiliated, and they have promised to share their latest thinking on that with us today.
Now, you’re all undoubtedly familiar with the Gallup poll and with its editor-in-chief, Frank Newport. In addition to overseeing all of Gallup’s surveys, which is an enormous endeavor, Frank has a particular interest in religious trends, as he showed in his book, which came out last December, “God Is Alive and Well: The Future of Religion in America.” Frank’s book took a different perspective on religious trends in America, that is, I think, in many ways a valuable counterpoint or corrective to the emphasis on the “nones,” and we look forward to hearing more about that. And, of course, we at the Pew Research Center also have some interesting data on religion in America, and I can’t think of a better person to discuss it than Greg Smith, our director of U.S. religion surveys.
So our format for this event is simple: Mike and Claude are going to speak for about 15 minutes on their research on religion using the General Social Survey, and then Frank will offer his insights on trends on religion in America in Gallup surveys, also for about 15 minutes. Then Greg will follow by briefly discussing the Pew Research Center’s findings on the rise of the religiously unaffiliated and other important trends. Greg has the home-court advantage, so he gets less time. Then we’ll invite the rest of you around the table to join us in the conversation. I should point out, this event is on the record and we are taping it. You are free to live tweet it, if you like. We’re taping this event. We expect to have a transcript on our website in a week or two. With that, I’ll turn it over to Mike and Claude.
[laughter]
OK, let me put this trend – this increase from 7% to 14% and we will see on further – into context. Four comments here. One, Americans have long been, and still remain, the most religious people among the peoples of the Western nations, both in faith and in practice, especially compared to Western nations that are predominantly Protestant, as the U.S. is. Second, church membership and religious activity have waxed and waned and cycled over American history, but over the long run, over two centuries, both membership and activity have in net increased. Americans’ level of religious involvement peaked in the 1950s. Despite recent downward tendency, religious involvement is still higher than it was a century ago. Third, Americans’ relationship to their churches exemplifies the volunteerism that is central to our culture; that is, it is not that Americans are individualistic, they do believe in community, but it is a community that is voluntarily chosen and rechosen every day. When Americans are disappointed in their churches, they exit and usually look for another church. Recently, for many nonconservatives, it is organized religion as a whole that has disappointed them, and many of the disappointed now opt for labeling themselves as “spiritual, but not religious.” Finally, politics and religion have long mixed. Typically, Americans’ religious identities drive their politics, but often it is the other way around. We know that to be true in other countries, such as when the Irish embraced the Catholic Church as a way of expressing their opposition to England, and the Poles did the same with respect to Soviet rule. There are signs that now, in the United States, we are seeing political polarization starting to drive people’s religious identification. A question for future research is whether it will also end up driving faith itself. Now, I’ll turn it over to Mike.
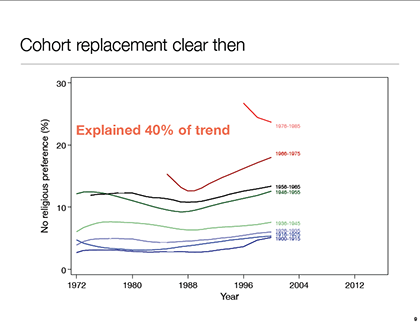
MICHAEL HOUT, NEW YORK UNIVERSITY: Thank you, Claude. I’m also very happy to be here today, and the agenda is pretty simple. We’re going to update the trends through 2012 – the most recent GSS data that we have – and then to try to begin a discussion of what is behind the generational change, which we identified in the 2002 paper as accounting for about 40% of the overall trend, and we’ve now – We’re going to update that estimate to about 60%, actually, of the total trend – as that has to do with the fact that the so-called greatest generation is passing away and being replaced by millennials who have much less attachment to organized religion and organized anything else, as near as we can tell.
First, on the trend, the blue is what we had under observation in the 2002 data, that is to say they trend up through the year 2000. The little dots are the actual percentages in a survey; the vertical bar showed the 95% confidence interval around that; and what we see here is a trend line that we estimate using a kind of moving average called a “locally estimated regression.”
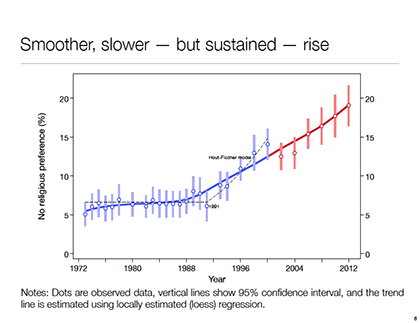
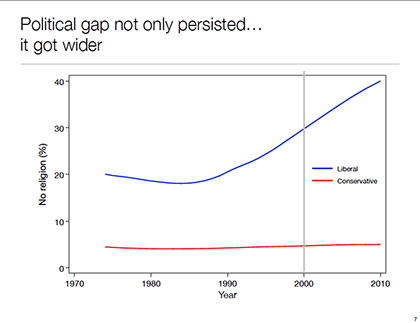
In contrast to that – The little – the line here with the dashed lines – skinny, tight – are the estimates that we published in 2002, and we probably over fit the data a bit – we ran the flat line too far and thus, put this line too steep. If you just make a projection of this upward, we should see about 27% of Americans had no religion in the 2012 survey and, in fact, what we observe is closer to 19%. So what the new estimates provide is, first of all, an earlier starting point and, most importantly, a much more gradual trend over time than we saw in the other one, and that gradual trend is one of the fingerprints of generational trend and is – generational change and generational succession – and is therefore part of the basis for our decision that – or our estimate that the generational trend accounts for about 60%, rather than our previous estimate of 40% of the secular trend over time. This is what we had in the way of a political gap to look at the – in the year 2000, that was in the 2002 paper.
Since then it has continued to widen. There’s still not much of a trend toward no religion among people who describe themselves as politically conservative, whereas for those who describe themselves as politically liberal, it is continuing upward and is in the neighborhood of 40% now.
The trick here – and I think everybody can understand that. All right. That’s the politics, and Claude articulated our argument on that pretty clearly just a minute ago. Without a Ph.D. in demography, the generational argument might be a little hard to fully understand. If generations account – generational succession completely accounted for the trend over time and the fraction of Americans who have no religious preference – now when we break out Americans by the year in which they were born, what we would see would be a bunch of flat lines, the ones where the oldest cohorts ending at some point, when there aren’t any longer enough of them who are – and they’re being replaced by people who initially are too young to talk in a survey of adults, but we start to hear from, and that’s – If cohort completely explained everything, these lines would all be flat. In fact, we see a lot – to a first approximation, these for older people are, in fact, flat. For the baby boom generation, we actually saw a movement toward religion as they married and started having kids. We all quit church in college, but then it came time to maybe baptize that kid and some of us made the move back, but there is, net on that, a slight upward movement after about 1986 for the baby boom cohorts showing a movement away from organized religion; we call that a period of vet. It’s much stronger for the so-called Gen X’s born 1966 to 1975. This, we actually had very little data on this cohort, 1976 to ’85; if anything, it was moving away – toward religion, maybe echoing some of this life cycle stuff.
What we see now in the – oh, and that explained 40%. Flat lines would’ve explained 100%; because they dip and rise, it’s only 40%. What we see since is a lot of flatness for the baby boomers and the millennials, and a movement away again among the so-called millennials and this group that we have born since ’85 that we have very few observations on. We’ve simply plugged in their average to show that the average is higher, but we really can’t estimate a trend for them.
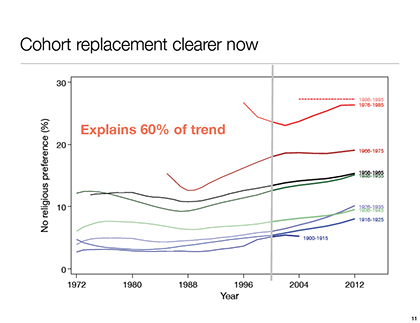
Meanwhile, we lose track of those born 1900 to 1915, and we’re starting to lose track of the 1916 to 1925 cohort, and so the new estimate is that this generational succession, the fact that these people are replacing these people in the population, accounts for 60% of the overall trend away from organized religion. What explains these cohort differences, they are – it’s just another clock. We’ve replaced the clock that runs in real time with one that tracks people’s birth rate. We really have – there’s no substance to birth – we give them all these names: greatest generation, millennial, and so on, but there isn’t much in the way of substance behind that.
[in 2012]
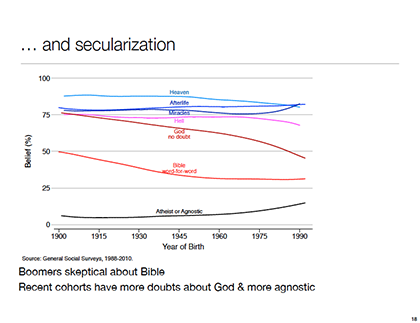
Younger people do have doubts about whether God exists, although there’s not much of a trend toward atheism or agnosticism among them to the extent to which there’s any going on; it’s for people born since ’75, that baby boomers moved away from – well, in the earliest cohorts, half of people thought the Bible was literally the word of God. By – those born in the ’50s and ’60s, it was one-third, and there’s been no change since then. So we’ve combined all this information into a secularization index and put that in our statistical model as well. So our statistical test consists of – We control for standard demographic characteristics, putting dummy variables for each single year of the General Social Survey, and then a thing called the “cohort random effect” that I’m not going to tie you down with here; I could put you all to sleep right after lunch – but it’s a way of marking how big the cohort’s succession factor is. Then we refit that that model with cultural attitudes, the values measured having to do with whether people think it’s more important to parents to instill thinking for themselves in children rather than obedience in children, and our secularization index, and if these things account for the cohort difference, then a coefficient representing how spread out these cohorts are will trend toward zero and be replaced by these three factors. Also, they’ll get a regression weight, a coefficient that represents how important it is and we’ll – we can talk about that. Oh, yes, there’s one important point about it, that’s why I’m in this slide.
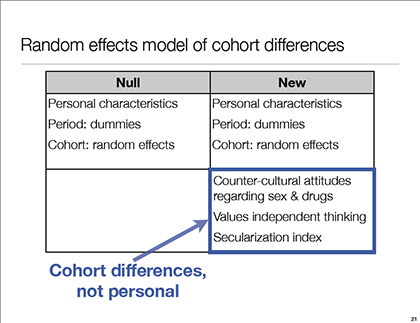
These are just – we’re just measuring differences between cohorts; we’re not entering a person’s actual answer to a question about “Do you think it’s more important for a kid to think for himself or obey her parents?” or “Do you think that gay sex is always right or always wrong?” but rather the cohort’s representation. So these are zeitgeist measures as a way of getting away from the prospect that having a religion is going to influence how people answer this question, but the cohort’s average is going to reflect the overall view of people of that generation. So when we run a statistical horse race, here is what we get. First, in the null model, the measure of the spread of the cohort random effects is substantial and statistically significant. When we enter our three explanatory factors, it’s still statistically significant, but only 20% is big. So we’ve accounted for about 80% of the cohort with our three variables – actually, with two of the three. It’s just the countercultural attitudes regarding sex and drugs, and the value on thinking for oneself, rather than obedience. The secularization, even though we have leaned heavily over and cherry-picked a couple of indices that are really strongly indicative of secularization, comes through with absolutely no effect; the standard error and the coefficient are the same size to a first approximation.
[laughter]
COOPERMAN: That’s very, very provocative. I’m sure there’ll be a lot of questions about it, but let’s hear from Frank, from Greg, and then we’ll open up the discussion.
[Research]
Part of what I’m looking at here takes off from a comment that Claude made in his introduction there, which is to keep in mind that we’re talking about, in religious identification, one measure of religiosity, but it is not necessarily correlated with or the same as many other possible measures of religiosity. We’re talking about a self label in a question in a survey, which is, “What is your religious identity?” We have our question wording in this panel here – excuse me, in the paper. We’re talking about one question where the respondent is asked to choose among those labels to self-report for themselves to a survey interviewer, and although all the other questions of religiosity that we measure in a survey context are also self-reports, they can be different, because some of them were asking a respondent to self-report on past behavior, most notably, church attendance; others were asking respondents to access cognitive states like importance of religion; and then there is another series of measures that we saw on Mike’s chart there of belief in various aspects of religion, which are the same thing, asking people to assess what’s going on up in the brain. But when we asked religious identity, in some ways it’s different because we’re asking people to publicly put a label on themselves in a given arena, and I think that there – and that’s what I want to talk about here, is that part of what we may be seeing here is a change in the way that people choose to label themselves, rather than something which represents a more fundamental change in some of the other measures of religiosity that we can look at.
Now, I give as an example, LGBT status, which without resorting to data – this is a hypothetical – it’s certainly possible that the underlying percentage of Americans who on a variety of personal measures would be LGBT, the percentage who would self-identify as LGBT, over time could rise for no other reason than the social and normative environment in which people are asked to self-label could change. In other words, it’s much easier, we can presume, in this hypothetical situation, for a person to say, “Yes, I’m LGBT,” today than it might have been in the ’50s or ’60s, even though that same person in terms of personal behavior and lifestyle was exactly the same. So that’s kind of what I want to look at here, based on some data, and see if we can get some preliminary interest in and focus on some aspects of this labeling hypothesis.
I’m using a telescoped microcosm of data, which may or may not be legitimate. We have longstanding Gallup data, but we don’t ask questions – GSS, of course, has the tremendous virtue that it’s been held quite constant in many of the ways questions are asked over time, and although a lot of what Gallup has asked had been quite constant – like “Do you approve or disapprove of the performance of the president?” – a lot of religious measures have varied over the years, and they’re not always in the same survey and in the same context as other measures of religion, so it’s somewhat more difficult to go back in our data – two decades ago, ’50s, ’60s, and ’70s – and replicate a wide variety of questions asked in the same way that we might be asking today. But starting in January – Jan. 2, 2008 – Gallup began its daily tracking program. For a variety of reasons, we’re very fortunate to be able to do it and basically, we interview 1,000 people a day, which means we’ve now interviewed up through the end of last year more than 1.7 million people and luckily, we were able to embed in that survey, among a variety of other questions, several – not a huge battery, but several – questions on religion which we can then look at and analyze. So what I’ve chosen to do here is look at about 300,000+ interviews that we conducted in 2008, fast-forward to the exact same questions asked using the same methodology in 2012, a five-year period, and saying, Aha! If we can look at some changes over this five-year period, maybe we’ve provided some insights into what might be happening had we been able to go back to the ’50s or ’60s, and compare it to where we are now, which we’re not, because we didn’t have the same battery of questions back then.
[Laughter]

[laughter]
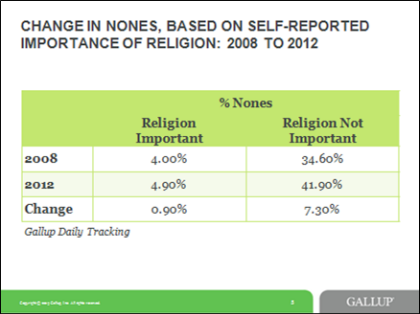
[The chart below has been updated to reflect the correct percentages for “religion not important.”]
[it’s]
So I’ll pause for a moment. I’m going to show you the other indicator, but this is probably the heart of the matter as far as what I’m talking about here today – is that the change came in self-identification is a “none” among people who in both surveys were already not very religious. So the suggestion is – the hypothesis is, if what we’re seeing here is a change in labeling, rather than a change in underlying religiosity – at least to some degree, that’s what seems to be contributing to it – phrased differently as I did a moment ago in my LGBT example, it can be hypothesized that these people for whom religion wasn’t important now feel freer to tell a survey interviewer that they don’t have a religious identity. Or there are other cultural forces at work which make it easier for them to say, “Yeah, I don’t have religious identity” in 2012 than they did in 2008, even though underneath it all, they were – religion was not important in both samples. In other words, if it had been a panel holding constant for the moment, test, retest and all that, we would have supposed exactly the same – people wouldn’t have changed in religion “important,” but they did change, in fact, in labeling. So that leads us to the conclusion that we are seeing the change in self-labeling on religious identification that is not consistent with a change in self-reports and other measures of religiosity.
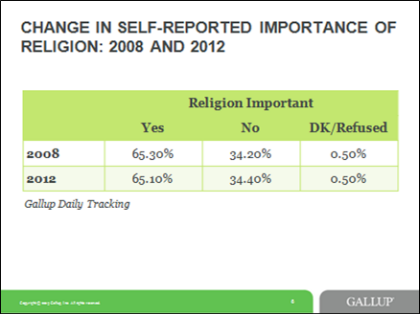
Now, I’m showing you the same thing; this is a – just to show you what happened overall, there was very little change here, only 0.2% in the percent of the sample who said that religion was not important between the two samples.
[in each group]
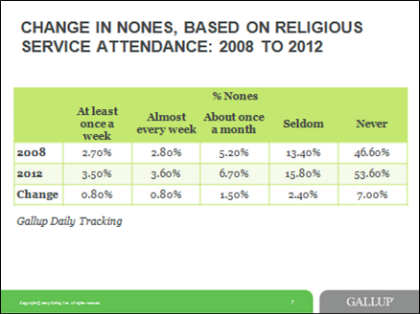
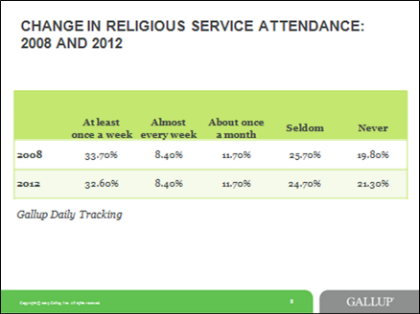
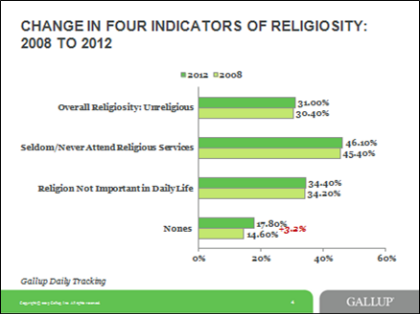
So again, it’s a second piece of evidence along the same route that the first piece of evidence on religion’s importance led us to, and that is that we are seeing the change in this microcosm five-year period of time along people who are not religious in either sample. It’s just something about – and as I say, at the end of the paper – I’m not sure exactly what that is, and that’s room for additional exploration and probably taps into a lot of the other things that the other scholars here have been looking at. Something has changed over time which makes these people who never attended church to begin with feel freer to tell a survey interviewer, “Yeah, I don’t have a religious identification.” In other words, in ’08, 7% more of them said, “I’m Catholic, Protestant, Jewish, Baptist,” whatever it was, than was the case in 2012. Now, over this period of time, we had a slightly higher change in the religious attendance, but not much. This was fairly constant. The “nevers” went up slightly, but none of these changes in religious attendance approximated as we saw in that first chart, the 3.2% that we found in “nones.”
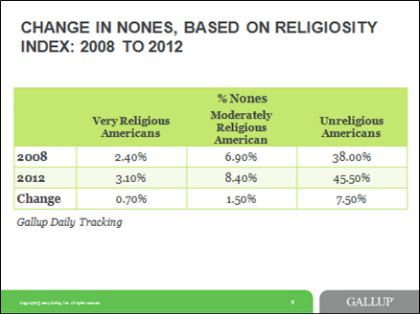
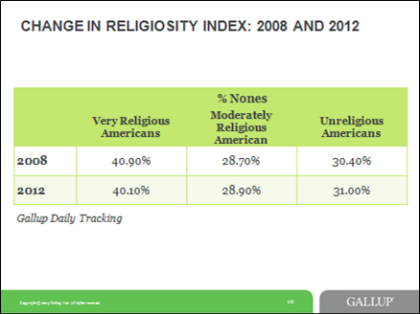
Just to reinforce the same thing, this is our Gallup grouping of people. It’s just a restatement of what you’ve seen because these categories are based on an algorithm with those two – not a fancy algorithm – but an algorithm of those two questions on religious importance and church attendance, and by grouping these people, we see the same thing among the people we classify as very religious. Basically, these are people for whom religion is personally important and who are frequent religious service attenders – very little change in the percent “nones” – the percent change “nones” as we would imagine – because you’ve just seen previous slides – came among those people who are unreligious.
So all of this compounds to the same basic conclusion, that we have seen the change – at least in these five years – in the already unreligious who are just changing the way they label themselves rather than changing the labels.
Now, there’s a lot of issues here that we can talk about, and just because I don’t go to church and say religion is not important doesn’t mean that I couldn’t have shifted even more to not going to church or religion was even less important in those two times, because these are not highly refined categories, they’re broad categories. But what we can say is that we did not see the change in these broad categories of religiosity over time. We did see the change in the “nones,” and the “nones” came for the most part among people who are unreligious both in ’08 and in ’12, but for some reason in ’12 felt – or just to say it behaviorally, for some reason in 2012, told survey interviewers – 300,000 of them – that they had no religious identity to the tune of about 7.5% more than they did back in 2008.
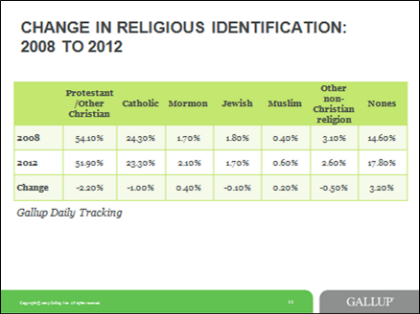
Now, because the data here, I wanted to show – this is very little change in these over time. I wanted to show you just a couple of other things here that may get at these – food for thought before my time is up and I get the hook here, OK? We wanted to look at the change in “nones” just in these five years – change in religious affiliation. Basically – and I think you all will agree if you’ve looked at it – when you look at the change in “nones” in the long-term, the Catholics have been relatively stable. Most of the “nones” have come out at the hide of Protestants, or what we call “Protestant and other Christians.” In other words, that’s been the change over time. Catholics, for a variety of reasons, including immigration of majority-Catholic Hispanics over time, have been able to hold their own, but in these five years, they actually fell by a point, Protestants fell 2.2%, and others, there were slight changes over time in our religious identification; Muslims actually went up slightly; and this, of course, is the 3.2% that we’re seeing. But I thought this was – and we’ll come back to that in a bit.
Here is something that our large sample sizes allow us to do, which I always think is fascinating – we can actually look at religiosity by each age point. George W. Bush is 67; we know that because he just had a stent put in, right, in Dallas. So we can actually find 67-year-olds and look how religious they are, and compare that to George W. Bush as an example.
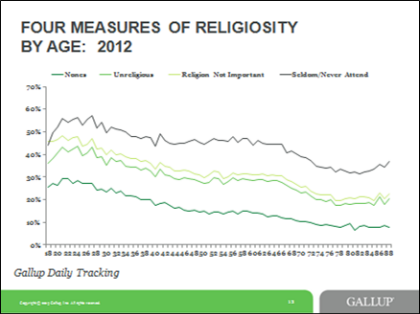
Trends are the same; this is a well-established pattern of the relationship between age and religiosity that we’ve all seen before. It starts out – these are negative numbers going up. People are more religious when we capture them at age 18 or 19 because they’re still in the home, we think, but as you’ve just said, everybody goes to college and ceases to be religious. I say everybody – people who go to Brigham Young and others may not, but for the majority of college students, we see – religiosity going up, and it comes down in some measures; it’s been plateauing in the 40s and 50s, and then after the 60s, it goes down.
I talk a lot about it in my book. This group of people who are 65 and over are going to double in the next 20 years, or at least just a couple of years – already the leading age of the baby boomers, including George W. Bush, are already past that point. But what’s going to happen is these baby boomers move to this cohort, right? That’s a fascinating question: Will it be generational, so that they, too, will become more religious, or will it be a cohort where they don’t? Maybe you all can answer that question, but that’s a real key to the future of religion, is what’s going to happen? My point here is there’s a pretty high correlation between all these measures. So cross-sectionally, the “nones” are getting at the same thing as these other measures, as we look at it by age, which I think is an interesting pattern, although there are some differences. Look at the 2008 and 2012, by age percent of “nones.” Statistically, there’s a main effect for a year, right? In other words, we can see that for – in every little – right here in the early 50s, and I’m not sure what’s going on here, but statistically, there’s a main effect for years, so no matter what your age, you’d drop between 2012 – back 2008 and 2012. Everybody at every age point became less religious.
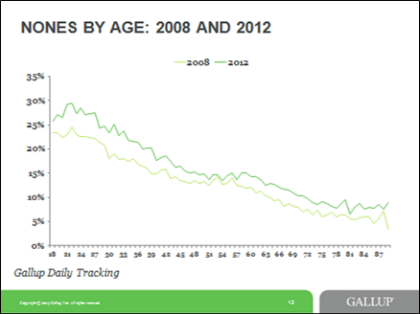
So the 87-year – well, that’s a little aberration there, but 80-year-olds that we interviewed in 2008, now when we interviewed 80-year-olds in 2012, they’re more likely to be “nones” than they were back in 2008. You can notice, if you’re perspicacious, which fits into your point here, there’s a little wider gap there, and so I put this together here. This is the change in “nones” by age point between 2008 and 2012, and it was highest among the young generation. So we have more of a shift here.
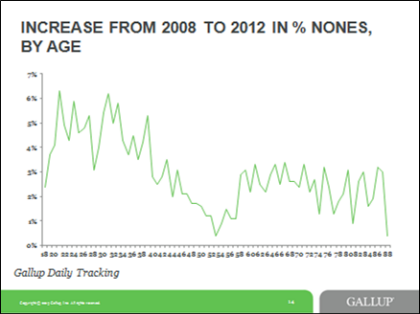
In other words, people of this age now have shifted higher than average in terms of “nones” compared to 2008 than other people. These are baby boomers when they’re about 47, 48 and on, and I’m not sure why they didn’t shift, but we actually have some shifting up here as well, which is a totally separate question, but we are seeing some more change in that younger cohort than we do find elsewhere.
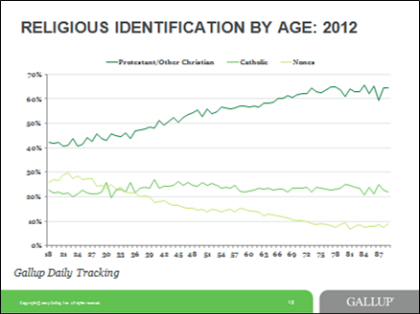
Just a couple of final things; I found this fascinating – this is back to my Catholic idea; this is cross-sectional. This is only 2012. This is age across the bottom axis, and then we see, of course, the percent of “nones,” which is here, declining with age and that’s the standard pattern that we see with measures of religiosity, and of course, what’s happening is, as I’ve said, it’s coming out of the hides of Protestants, right? Young people are significantly less likely to identify as Protestant or other non-Catholic Christian, and then that goes up as we get to older people cross-sectionally here, exactly concomitant with the decrease in the “nones,” and the Catholics have stayed fairly stable.
One hypothesis here is that Catholics – it’s more of an ascribed characteristic, as I’ve talked about, for Catholics, than it is for Protestants. “Protestants” is an amalgam of literally hundreds, if not thousands, of different denominations. You mentioned religious switching; I wrote a paper on that once. “Protestant” is a weird conglomeration of religions in this country where, I think, people may get habituated with the idea that they can change, and they can shift and so it may be easier, the hypothesis would go, for somebody who is a Protestant to change to a “none” than a Catholic, which it may be a little more like an ascribed characteristic sociologically, where if you’re Catholic, you’re a Catholic going forward. May be or not be the case, because of the Hispanic immigration, as I’ve mentioned earlier, that accounts for a lot of the stability in the percent Catholic in this country over time, but at least in this cross-sectional sample in 2012, we can see that, generationally, it’s the “nones” and the Protestants that are kind of playing musical chairs as we go across the age spectrum. I think that’s an interesting finding as well, and it leads to some speculation for some other things we can see going forward. I have the same data in here in a couple other ways, in some scatter plots, but it’s basically showing the same thing.
The bottom line out of this is that in a microcosm of five years in our samples, at any rate, we have seen the percent “nones” go up, which we would expect based on the chart we’ve seen and projections and every other bit of data we have. It looks like the significant majority of that increase in “nones” has come among people who were not religious in ’08 and who are not religious in 2012 either, based on extrapolations from two cross-sectional, not panel, surveys. So we’re seeing an increase among people who aren’t religious, which leads to the hypothesis I discuss in the paper, and it’s only a hypothesis because there are many other angles to come at it. But what we are seeing here, at least in the last five years, is people who are not very religious to begin with but who were clinging to a religious label earlier, are now finding it – freer, if that’s the word, or finding that they are in a situation when an interview calls them up, it’s easier for them to say, “Yeah, I’m none, I’m no longer going to cling to the label I cling to from early socialization because basically I’m not religious so now I’ll make all my labels conform.” So that’s a hypothesis that we can talk about and how that might extend back to where we are going back in time.
[Research]

GREG SMITH, PEW RESEARCH CENTER: Well, yes, this is conjecture, without having looked into it in any great depth. But when I see different surveys come out with different estimates of the share of the population that belongs to one religion or another, the number one thing I look to is question wording. I think that question wording – especially about religion – can make a big difference. I think that – In fact, you see this in our own data. We actually changed the way that we ask about religion here at the Pew Research Center back in 2007. Up until 2007, when we asked about people’s religious affiliation, we asked a close-ended question – we provided a number of options for people to choose, but we did not provide people with the explicit option to say they had no religion. They could volunteer that, and if they volunteered that they weren’t religious or had no religion or were atheist or agnostic, we recorded them as such, but the burden was on them to volunteer it. We did not list it among our options.
We were watching over the years all these same trends that we’ve just been discussing in the growth of the rise of the “nones” and we became convinced that not to provide people with that option would – to continue to not provide that option would be to miss in some ways what was clearly becoming a growing and increasingly important way that people identify themselves religiously. So in 2007, we changed the way we ask about religion, and we added the option for people to tell us what their religion is – we gave people the option to say they had no religion. The question we now ask is, “What is your present religion, if any? Are you Protestant, Catholic, Mormon, Orthodox – such as Greek or Russian Orthodox – Jewish, Muslim, Buddhist, Hindu, atheist, agnostic, something else, or nothing in particular?” And we take three of those categories – atheist, agnostic and nothing in particular – and that’s what we call the “nones.” I think it’s pretty similar to most other surveys. But when we made that switch in 2007 – and that’s all we changed was the way we asked the question – we saw an immediate uptick in the percentage of people identifying as “nones” by about three or four points. It went from about 12% before the switch to about 15% or 16% right after the switch. So that’s what we’ve experienced, and I think – that’s why I say – that’s the first thing I look to, to try to understand differences.
[The following exchange has been edited for clarity.]
COOPERMAN: OK, just to clarify, in Pew Research surveys, that last response option is “nothing in particular,” while in General Social Surveys, Mike and Claude, the last response option is “no religion,” have I got that right?
HOUT: Yes.
FISCHER: “No religious preference.”
COOPERMAN: Wait, the response option offered to respondents in the GSS is “no religious preference” or “no religion”?
HOUT: The stem question is “What’s your religious preference?” The response options are: “Would that be Catholic, Protestant, Jewish, something else or nothing at all, no religion?”
COOPERMAN: OK, so in the GSS, it’s “no religion,” in Pew Research surveys, it’s “nothing in particular.” Frank, what’s the wording of the Gallup question about religious affiliation?
NEWPORT: We do not have atheists or agnostics, but it is “no religion.” “Catholic, Mormon … another religion, or no religion.”
[Nods of assent from the panel.]
[all]
OK. So what I thought I’d try to do is, number one, echo Alan’s gratitude to our guests. It’s a real honor for me to be on this panel and to participate with such esteemed scholars of religion, and I’ve really been looking forward to this session; I’m looking forward to our discussion. I will try to keep my remarks brief. What I thought I would try to do is to try and reconcile what might be two countervailing pieces of evidence. On the one hand, we have seen that the “nones” have been growing, and we have seen that there is reason to expect their ranks to continue to grow. If the change is being driven largely by generational replacement, and young people are more likely to be “nones” than older people, then as they age into the population, the country should become less religiously affiliated. At the same time, there’s other evidence that would lead us to expect maybe there will be a religious resurgence. If people get more religious – If people become more religiously affiliated as they age, then as baby boomers get older, as the 76 million baby boomers in the United States age and become retired, if they become more religiously affiliated, then that might lead us to expect that religious affiliation will increase, that we’ll see a reversal of some of these trends. I don’t know which of those two things will happen, but I can, I think, try and offer a couple of things that we might keep in mind to help us anticipate the future.
[as]

So let me just try to clarify what I mean by some of that. Number one, the religious “nones” are not uniformly secular, and to equate them with nonbelievers would be a real mistake. We’ve talked a little bit about how we define this group in our surveys. If you tell us you are atheist or agnostic, or that your religion is “nothing in particular,” we count you as a “none.” But you can see here that most “nones” are not atheists or agnostics. Instead the big majority are people who describe their religion as “nothing in particular.” They have not sworn off religious belief altogether; they’re simply not personally associated with any particular religious organization.
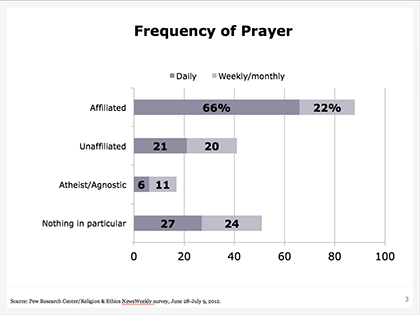
We can also see quickly that many people who are religiously unaffiliated tell us they pray. Four-in-ten “nones” overall tell us that they pray at least once a month, and more than half of that big group of people who say their religion is “nothing in particular,” more than half of them say that they pray once a month.
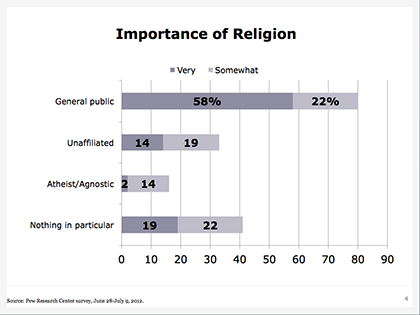
We see the same kind of thing when we ask people, “How important is religion to you and your life?” About one-third of the religiously unaffiliated say religion is at least somewhat important to them, and that includes four-in-ten among those whose religion is nothing in particular.
Now, obviously, on these measures, the “nones” are substantially less religious than the public as a whole; that’s also worth remembering. But nevertheless, you can see that it would be a mistake to assume that this group consists entirely of nonbelievers or people who are not religious. It’s also not clear, as we’ve discussed, that the growing ranks of the “nones” is an inherent indicator of secularization, and this chart makes much the same point that we’ve already seen. It shows trends in religious disaffiliation by frequency of religious attendance over time.
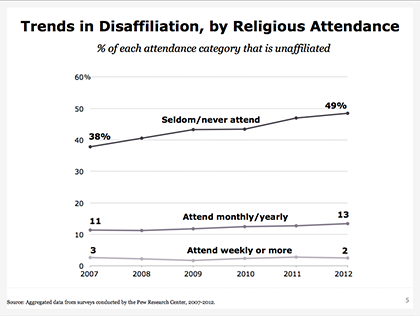
We use religious attendance as a rough but very valuable indicator of religious commitment, and what we can see is that just over the last five or six years, among people who tell us they seldom or never attend religious services, there’s been a sharp uptick in the ranks of the “nones,” from 38% in 2007, all the way up to 49% today. At the same time, among those people who attend religious services more frequently, the trend line has been very stable; there’s been no change in the percentage who described themselves as religious “nones.” Now, over the same period of time, there really hasn’t been much change in how often people say they attend religious services. The number of people who say they seldom or never attend really isn’t changing very much. It’s just that these people are becoming more likely to describe themselves as religiously unaffiliated. So this is just more evidence of what we’ve already seen.
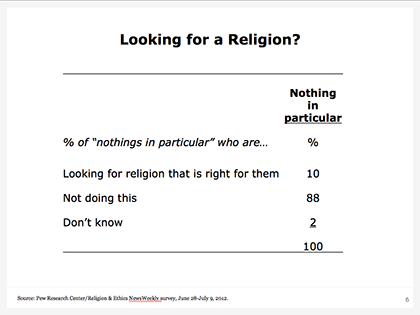
So it would be a mistake to conflate the “nones” with nonbelievers, and it would even be a mistake to infer that the growing share of the population that’s unaffiliated is necessarily an indicator of secularization. But I think this is just as important – It would also be a mistake to conceive of the “nones” as a group of spiritual seekers or practitioners of new and alternative forms of religion. As I’ve mentioned, I point this out not because anybody in this room necessarily makes this assumption, but I have talked to people over the years who do seem to make that mistake. This, I thought, was a really interesting question we asked on a survey last year. We asked those people who described their religion as “nothing in particular” – We asked them directly, “Would you say you’re just looking for the religion that would be right for you, or are you not doing this?” And the overwhelming majority, nine-in-ten, tell us, “I’m not doing that.”
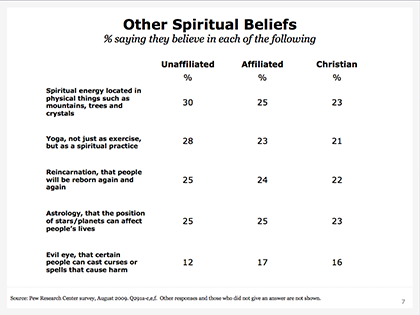
There are “nones” who say that they believe in yoga as a spiritual practice and not just as exercise. I thought that was an interesting question. There are “nones” who tell us they believe in reincarnation, that they believe in astrology, but it’s not a majority of them. And they do not express these kinds of beliefs at rates any higher than what we see among the general public.
[Religion & Public Life Project Director Luis Lugo’s]
So they’re not uniformly secular, but I also want us to remember that this does not mean that this large group of people is out there just searching, just waiting, just looking for the religious organization or religious community that’s right for them. They’re not doing that either.
Let’s turn and think about what will the future hold for American religion? Will “nones” continue to grow as a share of the population? Will the United States become more religious, or will it become less religious, or will it stay about the same? I, by my nature, am a pretty cautious person, so I try to stay away from too much in the way of prediction. I think it’s much easier to look backward, and if we do that, as Frank pointed out, we can clearly see that people do tend to become more religious as they age in some important ways, and I think prayer is a good example of this. These data come from the General Social Survey, and it’s just a little different way of classifying some of the generational cohorts than what we saw earlier. What you can see here – and what it shows – is the percentage of people who say they pray every day among different generational cohorts and how that has changed over time. And what the chart shows is that as a group of people gets older, they do become more prayerful.
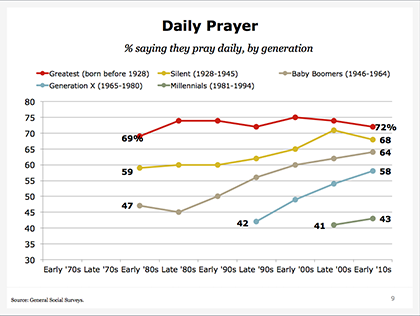
Back in the late 1980s, about 45% of baby boomers told us that they pray every day – or told GSS interviewers that they pray every day. Today, or most recently, two-thirds of baby boomers say that they pray every day, and you see the same kind of pattern with each of the other generational cohorts. Forty-two percent of Gen Xers said that they pray daily in the late ’90s. Today, 58% of the same group of people, Generation Xers, tells the GSS that they pray every day.
[laughter]
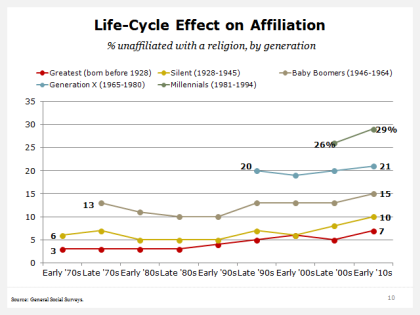
Now, if people became more religiously affiliated as they aged, then these lines would be sloping downward from left to right, because they would be becoming less unaffiliated. But that’s not what these lines look like; they are all flat. Members of the silent generation – born between 1928 and 1945 – are just as unaffiliated today as they were way back in the early 1970s. I think the baby boom generation is interesting as well. In the late ’70s, 13% of baby boomers were religiously unaffiliated; today, 15% of baby boomers are religious “nones” – no change whatsoever. So if past is precedent, then this would suggest that we won’t necessarily see an uptick in religious affiliation as the population ages.

Now, we have seen and we’ve shown and we’ve discussed how and why being religiously unaffiliated is not necessarily an indicator that someone is a nonbeliever. And so growth in the size of the “nones” does not necessarily mean – It does not necessarily mean that the country is becoming less religious. I think that point is absolutely correct, but I would also conclude by pointing out that one key characteristic, and I think and I know this is the argument that you have made as well, perhaps the key defining characteristic of the religiously unaffiliated population is that they do not go to church. They might pray. We’ve seen that. They might say that religion is at least somewhat important to them personally. Many of them believe in God. But they do not attend religious services. In our recent surveys, we find that just 5% of religiously unaffiliated people tell us that they attend religious services at least once a week, and three-quarters of them tell us that they seldom or never attend religious services.
So I would end, and I hope that this isn’t too unsatisfying or disappointing, but I would end my remarks with a question – and maybe we can consider it in our discussion but I definitely think it’s worth keeping in mind whenever we think about the future of religion in the United States – and that question is: Over and above what all of these trends suggest about secularization, and regardless of whether the country is becoming more or less religious, what does the continued growth of the “nones” – combined with their detachment from churches and religious organizations – what does that suggest for the future of American religion? That is, even if many “nones” are believers, and even if many “nones” say that religion is important to them, what will it mean for American religious institutions and organizations – and American religion more broadly – if this group maintains its share of the population or even grows while simultaneously declining to participate in churches and synagogues and mosques? When I think of religion in the United States – what it means to be religious in the United States – I think of going to church, going to synagogue, going to mosque. If this group retains its share of the population and continues not to do that, then what will that mean for religion in the United States? One way of thinking about it is that in addition to considering how religious the United States is, we might also think about – and I know we do, I don’t mean to imply that we don’t, but we might also think about – how is the United States religious? So I’ll leave it at that and look forward to our discussion.
COOPERMAN: Terrific presentations by all of the panelists. Thank you very much. Let’s turn to questions; let’s make this a discussion. I’m just going to remind you of a couple things: This is on the record. We are going to have a transcript of this. You are being recorded. When you want to speak, you need to do two things – well, three things: raise your hand. I’ll take note. When it’s your turn, push the button, and the red light will go on and then you’re on. And then third, please identify yourself – your name and your journalistic organization or academic affiliation.
DAN MERICA, CNN BELIEF BLOG: Hi, guys, thank you so much for doing this. It’s really great. We’ve seen in the last – a few months even – a lot of attention given to atheist churches, or these forums people can go to and talk about atheism and come together as a community. How much do you think that will affect the willingness of people to come “out of the closet” and say, “I’m an atheist. I’m an agnostic,” or do you think it’ll have any effect? And what do you think it will do to the numbers that you guys have seen over time?
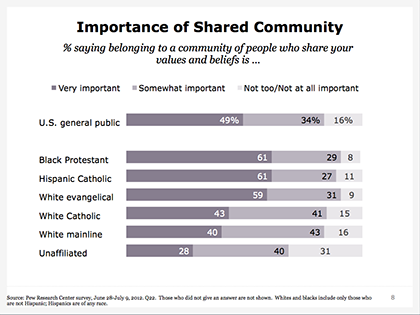
SMITH: It’s hard to know, and I don’t know quite what to make of the different gatherings and organizations that seek to bring together nonbelievers. I’ve read about them, but I think it’s interesting that most people who are religiously unaffiliated tell us they don’t feel any particular need to belong to that kind of an organization. It’s hard to anticipate how they might develop and what impact it might have on people’s willingness to say that they have no religion. But more broadly, and it’s very hard to measure this directly or point to data that provide direct support for this, but I do think that one of the things that’s gone on in American society over the last couple of decades is that it has become more acceptable to say that you don’t have any particular religion. I think that’s part of what we see, and you can see that in – I think, part of the reason I say that is that there are a number of trends that we measure where people do express some increased skepticism of religion. We have found recently an uptick, for example, in the number of people who say they think churches and other houses of worship should stay out of politics – social and political matters. We’ve seen more people telling us they think there’s too much religious talk in politics, for example, and so to the extent that people’s attitudes about religion might be becoming somewhat more negative – I shouldn’t overstate the degree of change but to the extent that’s changing, it may well be – People may well feel more comfortable telling an interviewer that they don’t identify with any particular religion.
FISCHER: Yes. I would just add that it’s not a new phenomenon. There were atheist organizations and rallies in the 19th century, and so it’s interesting, but it’s not novel.
MERICA: Just the idea though that they’re – they become regular every weekend, atheists getting together and meeting – is that – It might not be novel, but there are obviously organizations and meetings and stuff like that. If it becomes almost like a church-like experience where they go every Sunday, Saturday, whatever day and meet, do you see that as novel or is that – no?
HOUT: As Greg’s slide showed, 71% of the “nones” aren’t affiliated with anything, including atheism, so they don’t even identify with this group. And so I think it’s a small piece of the action.
NEWPORT: I would just say, I’m always cautionary until we have data. Journalists pick up on a trend and suddenly it becomes something that’s discussed, but whether there are actually more of these than existed before – or how many, or whether it’s more than a microscopic percent of the country – is an empirical question, so I don’t think we have much data on those.
SMITH: It would be interesting to know how atheists and agnostics interpret our questions about religious attendance. If you are an atheist who’s going to these kinds of meetings every week, would you pick up on that when we ask, “How often you attend religious services?” and say, “Yes, I go to that,” or would that not count? Should we develop a different question? I don’t know. It might be something worth thinking about.
ERIKA SEAMON, GEORGETOWN UNIVERSITY: I have been doing a lot work on interfaith marriage in America, a lot of qualitative work, and couples articulate this multiple religiosity that goes beyond, Greg, your slide on spirituality, yoga, reincarnation. They’re articulating beliefs in multiple traditions. They’re trying to piece this together. It’s really muddy and messy. They don’t have words to articulate it, but they don’t – Many of them, in a qualitative sense, have articulated that they don’t like the term “spiritual but not religious” or a “cultural” Catholic or Jew. They refuse to let go of the idea that they still have religious sensation in them, and yet there are no categories for them. So I would be really curious from all of you, actually, how, looking forward, maybe we can start developing questions that, perhaps, would be a subset of the “nothing in particular, no preference” category to really start to get at this multiple dynamic and hybridity dynamic that we’re seeing that continues to be messy. And are there plans to sort of write questions to look at that more deeply?
NEWPORT: Well, the GSS does ask spouse’s religion, does it not?
HOUT: We do, yes.
[that]
[of affiliation]
NEWPORT: Oh, I thought she’s talking about mixed marriages. Is that a different issue? I mean a Catholic marrying a Jew, that’s what you’re talking about?
SEAMON: Right. There’s the Catholic marrying the Jew. And then, now, we’re seeing particularly with the rise of the unaffiliated and new language around “no preference,” it seems to be getting messier. So in the ’50s, they’d say, “Yes, I grew up Catholic. I married a Jew. We decided to raise the children Catholic.” It’s clean-cut. No one likes to talk about not affiliating, but now with this new liberty to talk about disaffiliation, it’s not as neat and tidy, and so a lot of the survey data becomes less helpful in getting to that next layer down, in terms of how these families are actually operating and orchestrating their life. And my sense is that most of these families who decide not to clearly raise their children in one tradition or not – end up in this “nothing in particular, unaffiliated” sphere.
HOUT: Every 10 years at the GSS we come up with an extensive battery of questions on religion and then trim it down, a couple of them get promoted into the annual survey, and so these would be candidates for 2018. Unfortunately, it’s the years that end in eight. I guess, fortunately, we’ve got several years to come up with the exact wording that might work, and then we’ll try out a dozen or so and maybe one of them will survive. But right now, we don’t have – This is news to me – But one of the things we have talked about is asking people as we do with race. We follow the Census Bureau’s suggestion and let people name all they would – to try for a subsample to ask people to please give us all that apply, and because it’s a face-to-face, it’s not a form – We don’t have the exact format, and the board is not approving any of this yet, but that may come forward.
One last thing to toss out in this whole issue is that prior to the 1980s, a significant fraction of people were – About three-fourths of those who were raised with no religion, said they were raised with no religion, nonetheless declared a religion on the first question which is, “What’s your religious preference?” For the most part, the religion they named was their spouse’s religion, and increasingly, we see less and less of that all the time. There’s more agreement between the religion the person was raised in and their current religion among married people than with their spouse’s religion than in the past, so there’s less pressure to reconcile it to – Especially for those who were raised without.

STEVE SCHNECK, CATHOLIC UNIVERSITY: Thanks. We’ve been studying the phenomenon of the rise of libertarianism in politics, and it’s interesting that the rising number of people who in some way or another associate themselves with libertarianism or libertarian ideas – that would include opposition to organized institutions of all sorts, individualism and so on and so forth – seems to be happening at about the same time we see the rise of “nones.” And I’m wondering whether the panel thinks we’re looking at a similar phenomenon.
FISCHER: I’m skeptical. I mean, I think the rise of libertarianism is like another one of these headline things that I don’t know that we’re actually seeing in the data in any significant numbers. Frank probably tracks it better with his more frequent polls, and it’s inconsistent with one of the most dramatic graphs that Mike put up, which is that the growth in the “nones” is all among – overwhelmingly among – people who call themselves liberal and negligible among those who call themselves conservative. I would assume most libertarians when given that standard question pick the conservative end of that scale, and we certainly – There aren’t very many who say, “I don’t like that scale. I’m a Libertarian.” To the extent which we have any data, it would suggest it’s really not part of that story.
NEWPORT: Good question. I don’t know that we can actually track precisely. We don’t say, “Are you Republican, independent, Democrat or Libertarian?” We don’t track that directly. We have a lot of other indicators, but what your question raises, of course, is one of the other major trends we’re seeing in religion, and that’s the rise in unbranded religion, which we’ve all looked at carefully. Particularly in the Protestant domain, if there is growth – and where there is growth – it’s unbranded. By that I mean, Bible churches, non-denominational churches, mixed churches, churches with no official denomination of affiliation, so it might be part and parcel of the same kind of phenomenon, where people are feeling freer to move away from traditional institutions or parties or anything along those lines in today’s culture. It’s a viable and soundingly interesting hypothesis we just have to apply data to.
NATASHA MOZGOVAYA, WASHINGTON JEWISH WEEK: I have two questions: First of all, is this trend of rise of the “nones” more visible among specific religious groups? I mean, for example, specific denominations or something. And second, if we accept this hypothesis that people feel more comfortable to associate themselves as not religious or nonaffiliated, did we hit the ceiling, or with respect to the number of people who feel uncomfortable – continuing to rise?
NEWPORT: As you saw on the graph and in answer to your first question, it’s absolutely coming among the Protestant domain, which is big. We do not in our ongoing Gallup tracking, unfortunately, track denominations because, as you know, in the GSS, everybody else knows it’s very complex, in the ARIS, and all these surveys try to track denominations. So it’s very difficult to say that the “nones” are coming from Southern Baptist or they’re coming from Nazarene. All we can say is that over time, every graph I think will show that it’s the decrease in those who identify as Protestants, that it’s concomitant with the increase in “nones,” and for a variety of demographic and other reasons, the other big religious group in this country, which is Catholics in the low 20%. Twenty percent of Americans have stayed fairly constant. So in answer to your question, I would say it’s come from Protestants, but beyond that, we don’t have the data to speak to it. Whether we’ve reached a ceiling or not –
[and the Catholics, not the Protestants. That is what you learn from the question on religious origins in the GSS. After asking, “What is your religious preference?” we ask, “What religion were you raised in?”]
[laugher]
HOUT: The decline of the Protestants you’re seeing is the fact that for 50 years, they have one less kid than the rest of the population, and their average through that time was less than two. You take a couple and you have less than two kids, you’re sowing the seeds for a long-term population decline, and that’s exactly what we’re seeing. Catholics, on the other hand, had more than two. Their stasis is totally a demographic misdirect.
NEWPORT: By the way, we’re now seeing – We just looked at generations of Hispanics and I think that Catholic advantage may be lost, even among Hispanics going forward.
COOPERMAN: Greg, did you want to add something?
SMITH: Well, just to illustrate how interesting and complex this is, I think everything that’s being said here is accurate but it’s at first, at least for me, kind of mind-boggling to figure out how can it be accurate, but it is accurate. So this is what’s happening over time, over the long period of time. This comes from GSS data. The Protestant share of the population is shrinking – and that’s the point that Frank made – while the “nones” share of the population is growing, and the Catholic share of the population is holding steady. I like to point out to people that this is an enigma wrapped within a mystery because the Catholic share of the population is holding steady even though Catholics have the most net losses through religious switching of any religious group in the United States. There are four people who say they are a former Catholic for every one person who indicates that they have converted to Catholicism, and there are no other religious groups that I’ve seen that have anything like that ratio of losses to gains. So how can it be then, if that’s what’s occurring, that the Catholic share of the population is holding steady? The answer is there’s these other demographic factors that are serving to offset those losses through religious switching.
The same thing is true – but from the other direction – for religious “nones.” Religious “nones” are growing even though their retention rate is among the worst of the religious groups. Although I understand their retention rate is growing, there are more people who leave the ranks of the “nones” than there are for other religious groups. It’s just that their ranks are offset by people becoming nothing after having been raised Catholic or Protestant or whatever the case may be.
COOPERMAN: When you say more people leaving, you mean a higher percentage of people raised as “nones” become affiliated with a religion? They have a worse retention rate than any of the other religious groups?
SMITH: Yes, and that’s changing. Their retention rate is getting better over time, but nevertheless, their retention rate – the share of everyone who is raised as a “none” who are still “nones” – is lower. It’s lower than for Catholics. Two-thirds of everyone who is raised Catholic is still Catholic. That is higher than the percentage of people who are raised as “nones” who are still “nones.” It’s just that these changes – that these differences in religious switching – have to be considered along with the demographic factors and other things that are going on to understand how it all fits together.
AMY SULLIVAN, NEW REPUBLIC: Thanks. I just wanted to push Greg a little bit on the issue of “seekers,” especially in the context of the question you left us with, what are the consequences of this growth in the “not religious” – especially for religious institutions? Because I think a lot of clergy would look at the numbers of nine-out-of-ten of these unaffiliated saying that they’re not currently looking for the religion that’s right for them and say, “Well, we should just give up. There’s no market for us here,” but how do you, then, explain the four-in-ten of the unaffiliated who pray and who say that religion is an important part of their lives. Is it possible that the question is getting at their current motivation to look for a church and that, in fact, they could be activated as “seekers” from another life cycle event or something in their lives?
SMITH: Well, it’s certainly possible, but I’m glad you bring this up because the way that you framed it is actually the way that I have heard it expressed from religious leaders in the sense that, OK, so we know that the “nones” are growing, but since they have a religious pulse, so to speak, that means we can get them back. Maybe they can, and I’m not suggesting that anyone should give up or – and certainly can’t predict the future. Many of them may become associated with a religion or begin attending church, but I don’t think that that’s a foregone conclusion. And I think that we should keep in mind that not only do they tell us that they’re not looking, not only do they not really tell us that they feel a need to belong to a community of believers, but many of them weren’t going to church to begin with. So one way of illustrating that is – I’ve talked to religious leaders over the years, some of whom have said, “How do I reconcile the growth in the ‘nones’ with the fact that my congregation isn’t shrinking? There aren’t people who are leaving my congregation.” The answer is that the growth in the “nones” is being driven by people who weren’t there to begin with. So it’s not to suggest that nobody among the ranks of the “nones” will become religious or join a religious organization, but I do think that we shouldn’t assume – as is sometimes done – that these are necessarily losses or that these are people that are just waiting to be activated. They may become activated, but I don’t – it’s not so easy as just recapturing people we’ve lost. Does that make sense?
HOUT: The point I hinted at and would like emphasize now is that church isn’t the – Organized religion isn’t the only major American institution that they are distant from. They’re less likely to be married. They are less likely to be employed in an organization. They’re patching together a number of contingent jobs rather than working with a steady employer. And although they’re politically liberal, they don’t vote. And so I think that they are a detached population in a number of ways. There is one intriguing GSS question that – I keep looking around for possibly another one – that they don’t read the newspaper or watch TV either. So I’d like to figure out a little bit more about their media consumption, but we only have those items.
LUIS LUGO, PEW RESEARCH CENTER: I bet they’re “Bowling Alone” too –
[Laughter]
HOUT: Yes. We talked about the one Putnam book. This is a different Putnam story, yes.

MARK PATTISON, CATHOLIC NEWS SERVICE: A couple of questions, one may dovetail and one may not. I don’t know if 1973 is the first year with which you had enough solid data to offer these long-term trends, but I also keep thinking of 1973 as one of those watershed years where things may have started collapsing in the social fabric, which may, in turn, have started affecting people’s views about their own religiosity – because certainly, politically, the mushrooming of the Watergate scandal, and economically, the deterioration of the American dream, the lower purchasing power of the American worker coupled with persistent inflation and the oil embargo. I don’t know if that had anything to do with – people started to feel disaffected from organized religion. But by the same token, the other question would be if the changing cohorts represent 60% of this change in “nones,” what are the other factors accounting for the 40%?
HOUT: OK, two answers, ’73 was the first year the GSS asked, “What religion were you raised in?” That’s why I picked ’73. Yes, Claude and I wrote a book about the 20th century, and we really, really, really wished the NSF had started the General Social Survey in 1963 – or 1962 – instead of 1972, but we’re stuck with our starting date. We rely heavily on Gallup for all things prior to 1972.
The other 40%, I think, is this period effect, which is driven by politics. The data that both Frank and Greg showed indicates that these are disproportionally folks who were already disconnected from a church and were Catholic in name only, Baptist in name only or whatever. And when the religious right began to say, “This is what a religious person in America looks like,” they said, “Well, that’s not me,” and stepped back from it and quit identifying themselves as part of that community.
[exert]
HOUT: If they voted in greater numbers, the consequence would be great, but the fact that they’re so politically disaffected and detached – as well as religiously detached – mutes the impact of this on politics. The identification in their minds between certain churches and a conservative social agenda in politics makes them step back from the religious identification that they once held, but it is not pushing them to become politically active on the other side.
[In your tracking poll,]
NEWPORT: Well, it’s a fascinating question. I probably don’t have time to get into it in great depth. Obviously, religion is highly intertwined with politics. I’m not sure what you’re – If they did vote, how would they vote? How would you answer that, Mike?
[laughter]
COOPERMAN: Greg, do you want to comment on that?
[could that also be]
[side]
FISCHER: Another historical note. In the 1960s, there were people who were complaining about the churches and ministers being too political. What they were complaining about were the left-wing ministers involved in the civil rights, the anti-war, anti-nuclear movement. These things have historical ironies, and there was a moment in which religion was identified more often – That public religion was identified more often with the liberals than the conservatives. And we’re going through a patch where it’s the other way around.
CATHY GROSSMAN, RELIGION REPORTER: I have a double-barreled question. One is for the whole panel, and one is more for Greg. In the comparison of the different, the wording of the different questions that Alan did at the beginning of the discussion, every form of the question involved giving a list of choices. The American Religious Identification Survey is a wide open question; it’s “What is your religious identity, if any?” What are the advantages or disadvantages of leaving it totally wide open vs. some form of giving people something to check off? That’s question one. And more to Greg, you and I talked about a year ago about the group that I ended up labeling the “so-whats,” which are the “nones” who are not “seekers,” who are not doing something alternative. They’re not thinking about it at all. I actually think that there may be – do you see, let me put it this way – Do you see a growth in the number of people who simply – This is just not something of interest to them. They’re not out there looking for the inner meaning of the universe. They’re just going about their lives. Other things have higher priorities. They just give a big shrug to the whole issue. They’re not atheist, agnostic or anything in particular.
[in which case]
In terms of the “so-whats,” I think it’s an interesting question. I don’t know that we have hard data. I mean there are clearly people among the “nones” who are committed nonbelievers. They’ve thought about these things. They’ve thought about them carefully, and they have come down on one side of this and decided that they do not believe. On the other side, you have people who, even though they’re detached from religion – from religious institutions – really are religious by any of these measures. But then there’s that big group in the middle that is probably the “so-what” group that you asked about, and I do think that many of them are not interested in this, and aren’t thinking about it carefully, and are not seeking. And I think it’s the key difference between them and a group like libertarians, for example. Without commenting on the size of the groups or how they might be related in the data, just thinking about it, one key conceptual difference is libertarianism is a school of thought. It is a set of principles that people either agree with and adhere to or don’t, but being a “none” isn’t like that. I mean there are atheists and agnostics, that might be more akin to being a libertarian, but being “nothing in particular” can mean a whole bunch of different things, and it does mean a whole bunch of different things to a lot of different people. And so I think that – I’m glad you bring it up because I think it’s an important thing to keep in mind about this group. Not to overthink it in a way, right? There’s not necessarily more there than it appears.

[dis]
[way]
SMITH: Right. So married people – let’s see where is this chart? If you look just over the short-term, you see an increase in the percentage of the population that is religiously unaffiliated across a variety of social and demographic groups, but one exception to that is marital status. This is over the very short period of time between 2007 and 2012, there was a four-point uptick in the ranks of the “nones” among people who are not married, but among people who are married, there was no change over that same period of time.
COOPERMAN: Page 21.
[Pew Research’s “ ‘Nones’ on the Rise”]
PER SMITH, BOSTON UNIVERSITY: One major event that I rarely hear discussed in terms of the “nones” is the end of the Cold War, which happened in the end of the ’80s. I wonder if the ease at which people – the increasing ease at which people are able to identify as “nones,” if that’s the case, is related to the changing shape of American civil religion, of what it means to be an American vis-à-vis religious identification. I also wonder if that has something to do with the church attendance figures. I, at least, think that Mark Chaves and others have shown convincingly that people exaggerate church attendance when asked to self – to talk about how much they go to church themselves. Is it possible that people are feeling more comfortable not exaggerating those figures and that this is why you’re seeing that change with the “nones” in church attendance but not people who still identify within those communities?
FISCHER: Well, very clever question, and one that had not occurred to us, actually – the extent to which religion is part of the package of being an American, and if the issue of being an American vs. an atheistic communist has become less salient. That’s very interesting. I would not put my money on that. I want to reiterate one thing, and then I’ll close, which is, let us remember that the population that increasingly says “no religion” is a population – Frank made this point clearly – we actually make that point in the 2002 paper. It’s a population that was marginally religious to start with, and the argument, I think, here, we share, whatever the cultural atmosphere change has been, Cold War or the religious right or whatever, that group of people who weren’t very closely tied to religion in the first place are now increasingly making a declaration that they’re not religious. So I think if we want to understand that we have to understand where that change is coming from, and it’s coming from that group that used to say nominally, “Oh, I’m a Catholic,” and now either feel free – in Frank’s term – or feel politically pressed – which is what we argue – to make a declaration, “Religion is not for me.”
HOUT: I like more proximate causes than that, and I think that the politics of the 1980s were rife with “God is on our side” kinds of proclamations and that that was off-putting to a certain segment of the population. For example, presidents of the United States didn’t always say, “God bless America” into time immemorial. Ronald Reagan’s acceptance speech in 1980 is the second time a president uses that phrase. Teddy Roosevelt said it after McKinley got shot, and between there, nobody used that phrase. And then all of a sudden it becomes de rigueur. Obama says it all the time even. And I just think that that intertwining – the visibility, the “civil religion” phrase you use, I think the civil religion became actually more religious after the fall of the Berlin Wall than before, and that is more off-putting to more people than it used to be.
COOPERMAN: Frank, do you want to make a final point on this, or in general?
[Laughter]
COOPERMAN: Greg, did you want to have a final word?
G. SMITH: I’ll leave it at that.
[Laughter]
COOPERMAN: Thank you all. It’s been a wonderful discussion. Thank you all for coming. I want to thank our panelists. Terrific, terrific panel, thank you very much.
[NORC]


