When demographers attempt to forecast changes in the size of a population, they typically focus on four main factors: fertility rates, mortality rates (life expectancy), the initial age profile of the population (whether it is relatively old or relatively young to begin with) and migration. In the case of religious groups, a fifth factor is switching – how many people choose to enter and leave each group, including how many become unaffiliated with any religion.
This chapter presents an overview of each of these five main drivers of population change. It highlights important trends, discusses key assumptions about the future and acknowledges weak spots in the demographic data currently available on some countries and religious groups.
In some cases, this chapter also shows how different the projections would be if particular factors, such as migration, were not taken into account. These hypothetical scenarios are intended to give readers a sense of how much impact various factors have on the projections.
Fertility
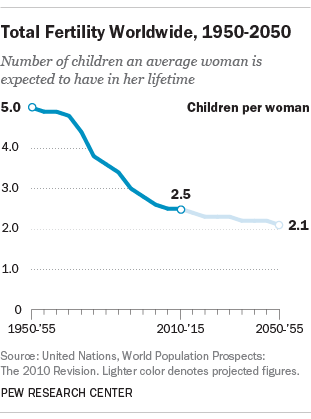
Over the last half century, the global fertility rate has fallen sharply.14 In the 1950 to 1955 period, the average woman was expected to have about five children over the course of her lifetime. By 2010-2015, the global average was about 2.5 children per woman.15 According to the United Nations Population Division, worldwide fertility rates are expected to continue to drop in the decades to come, gradually moving toward 2.1 children per woman, which is traditionally viewed as the “replacement level” needed to maintain a stable population in countries with low mortality rates among the young.16
As a result of declining fertility rates, global population growth is slowing. Over the four decades from 1970 to 2010, the number of people on Earth grew nearly 90%. From 2010 to 2050, the world’s population is expected to rise 35%, from roughly 7 billion to more than 9 billion.
Among the world’s major religious groups, Muslims have the highest Total Fertility Rate as of 2010-2015, a global average of 3.1 children per woman. This is one of the main reasons why the Muslim population is expected to grow not only in absolute numbers but also in relative terms – as a percentage of all the people in the world – in the decades to come.
Christians (2.7 children per woman) are the only other major religious group whose Total Fertility Rate, on a worldwide basis, exceeds the average for all women (2.5), during the present five-year period (2010-2015).

Globally, fertility among Hindus (2.4 children per woman) and Jews (2.3) is above the replacement level (2.1 children). Fertility rates among all the other groups – followers of folk religions (1.8), other religions as a whole (1.7), the religiously unaffiliated (1.7) and Buddhists (1.6) – are below the replacement level, meaning the groups are not bearing enough children to maintain their current populations, all else remaining equal.
One of the assumptions behind the U.N.’s global population forecasts, as well as the Pew Research projections, is that over time fertility rates generally converge toward the replacement level.17 If they start above the replacement level, they tend to decline. If they start below the replacement level, they tend to rise – although they may change slowly and may not actually reach the replacement level in the coming decades.
Thus, the religious groups with fertility rates above replacement level in 2010 – Muslims, Christians, Hindus and Jews – are expected to experience a decline in their fertility rates by 2050. Fertility rates for Muslims and Hindus are projected to decline most sharply – more than 20% – from 3.1 to 2.3 children per Muslim woman and from 2.4 to 1.8 children per Hindu woman. Among Christians, the fertility rate is projected to decline from 2.7 children to 2.3. The worldwide fertility rate among Jews also is expected to drop, albeit only slightly, from 2.3 in 2010 to 2.1 in 2050.

At the same time, fertility rates among the four religious groups that are below 2.1 children per woman as of 2010 – followers of folk religions, other religions, Buddhists and the unaffiliated – are expected to rise somewhat over the next four decades, moving closer to the replacement level.18
Country-Level Differences
Since some major religious groups are concentrated in a small number of countries, fertility patterns in a few countries can have a large influence on a group’s global fertility rate. For example, Hindus are expected to experience a decline in their Total Fertility Rate over the next four decades in part because India’s overall fertility rate has been dropping – from 5.9 children per woman in 1950 to 2.5 in 2010 – and is expected to fall to 1.9 by 2050. (Roughly 94% of the world’s Hindus live in India.)
Similarly, since roughly eight-in-ten of the world’s Jews live in either the United States or Israel, Jewish fertility rates are heavily influenced by patterns in those two countries. While Israel’s overall fertility rate is expected to decrease – from 2.9 in 2010 to 2.2 in 2050 – U.S. fertility rates are expected to stay relatively stable (around 2.1) over the same period. The combined impact is a slight decrease in Jewish fertility, globally.

China is home to at least half of all Buddhists, adherents of folk religions and religiously unaffiliated people in the world. Consequently, China’s fertility patterns have a substantial impact on expected fertility rates for these groups. The United Nations Population Division anticipates that China’s Total Fertility Rate will decrease from 1.6 children per woman in 2010 to 1.5 in 2020, and then begin rising, reaching 1.8 by 2050. Similarly, Buddhists, adherents of folk religions and religiously unaffiliated people are expected to experience a similar initial decline or plateau in their fertility rates, followed by a subsequent increase, as shown in this chart above.
Future fertility rates for each country in this report are based on forecasts published by the United Nations Population Division.19 While following the U.N.’s overall projections at the country level, however, researchers at the Pew Research Center and the International Institute for Applied Systems Analysis analyzed more than 200 censuses and surveys to calculate fertility rates specific to major religious groups within 135 countries and territories, which constitute 93% of the world’s 2010 population.20 An additional 3% of the world’s population live in 29 countries in which the overwhelming majority (over 95%) of people within the country belong to just one major religious group. In the remaining countries and territories, which include 4% of the world’s population, reliable data on fertility rates for religious groups were not available.21 In both of these latter categories, each religious group was assigned the country’s overall fertility rate.
Projections of future fertility rates within each country assume that differences in fertility levels between religious groups will slowly disappear (reaching convergence after 100 years – i.e., in the year 2110) as differences in their levels of education and access to contraceptives gradually attenuate.
Regional Differences in Fertility
Fertility patterns may vary between countries and larger geographic regions for a host of reasons, including cultural norms, levels of economic development, education systems and government policies that encourage or discourage family planning. Fertility rates also may be influenced by infant mortality rates, women’s participation in the labor market, income levels and social status, among other factors.
Of the six geographic regions analyzed in this report, only two have a Total Fertility Rate that is higher than the global average of 2.5 children per woman: sub-Saharan Africa (4.8) and the Middle East and North Africa (3.0). The Latin America-Caribbean region has the third-highest fertility rate (2.2), followed by the Asia-Pacific region (2.1) and North America (2.0). Europe is the only region with a fertility rate that is well below replacement level (1.6).

Sub-Saharan Africa and the Middle East-North Africa region, the two areas where fertility rates exceed the global average in the current period (2010-2015), are expected to have the highest rates of population growth in the coming decades. These are the only regions where population growth is expected to outpace global population growth from 2010 to 2050.
Within a single religious group, fertility rates can vary enormously depending on where people live. For example, Muslims in sub-Saharan Africa have a fertility rate of 5.6 children per woman, on average, while Muslims in Europe have an average of 2.1 children per woman. Similarly, religiously unaffiliated people in sub-Saharan Africa have more than four children per woman, on average, while the fertility rate among Europe’s unaffiliated population – 1.4 children per woman – is well below replacement level.
In most regions where reliable fertility data are available for religious groups, Muslims have more children per woman than the regional average. Muslims in sub-Saharan Africa have the highest Total Fertility Rate (5.6) of any major religious group in any large region. Across the Asia-Pacific region, North America and Europe, fertility rates among Muslims also are higher than among Christians and the unaffiliated. In the Middle East and North Africa, Muslims make up more than 90% of the population and are largely responsible for the region’s relatively high fertility rate (3.0).22
Because some religious groups are heavily concentrated in a few regions and are rare in other places, separate fertility rates cannot be reliably calculated for all groups in all regions. Reliable data on fertility levels are unavailable, for example, among the relatively small number of Jews in sub-Saharan Africa, Muslims in Latin America and the Caribbean and religiously unaffiliated people in the Middle East and North Africa.
In the two regions where overall population growth is expected to be fastest in the coming decades – sub-Saharan Africa and the Middle East-North Africa region – Christian fertility rates are lower than the regional averages (4.5 children per woman among Christians compared with 4.8 overall in sub-Saharan Africa, and 2.5 among Christians compared with 3.0 overall in the Middle East and North Africa). On the other hand, in the four regions where overall population growth is expected to be slower, Christian fertility rates equal or exceed the regional averages. In North America, for example, Christians have a higher fertility rate (2.1) than the regional population as a whole (2.0).
In almost every region where data are available, the unaffiliated have a fertility rate that is lower than the regional average. In sub-Saharan Africa, the Asia-Pacific region, North America and Europe, fertility among religiously unaffiliated people is lower than the regional averages and lower than the rates among Christians and Muslims. (See chart above.) The one exception is Latin America and the Caribbean, where the unaffiliated have slightly higher fertility (2.3 children per woman) than the regional average (2.2).
Hypothetical Scenarios: Seeing How Much Difference Fertility Makes
As previously noted, the projections in this report take into account differences in fertility rates among major religious groups within 135 countries and territories. Over time, these differences can be highly consequential. For example, Nigeria is estimated at present to have roughly equal numbers of Christians and Muslims, but Nigerian Muslims have a significantly higher Total Fertility Rate (6.5 children per woman) than Nigerian Christians (4.5). As a result, Muslims are expected to make up 59% of Nigeria’s population by 2050, while the Christian share is projected to drop to 39%.
One way to see the impact of fertility differences on population projections is to apply an alternative set of assumptions, such as assigning all religious groups within each country the same rate.
In Nigeria, for example, this hypothetical scenario would mean that both Christians and Muslims would be assigned – for the sake of illustration – the country’s average fertility rate (5.4 children per woman). If this were the case, in this alternate projection model, Nigeria’s total population in 2050 would be larger than it is today (this is also true in the main projection model), but the country’s religious composition would not change much over the coming decades, ending with nearly equal shares of Christians (48%) and Muslims (50%) in 2050.23 Comparing the results of the two scenarios, it is clear that Muslims’ higher fertility rates are gradually reshaping the country’s religious composition.
By contrast, at the global level, the alternative projection scenario would yield little change in the size of major religions. If one were to artificially assume that within each country, all religious groups shared the same fertility rate, Muslims would still be the fastest-growing major religious group worldwide, and the religious composition of the world in 2050 would look very similar to how it appears in the main projection scenario. There would be only a slight uptick in the Christian share of the world’s population (32% instead of 31%) and a corresponding decrease in the Muslim share (29% instead of 30%).
The outcomes of the two projection scenarios are similar because the future growth of religious groups is driven largely by differences in the geographic regions and individual countries in which the groups are concentrated. Since people’s fertility choices have much to do with their social and economic environments, differences in fertility between countries are often much greater than differences in fertility among religious groups within a single country. For example, as noted above, the Christian fertility rate in Nigeria is 4.5 children per woman, while the Muslim fertility rate in Nigeria is 6.5. In Australia, the fertility rates for Christians and Muslims are 2.0 and 3.0, respectively. In both places, the fertility rate among Muslims is higher than among Christians. But the differences inside each country are smaller than the differences between the two countries, with the average woman in Nigeria bearing about 3.5 more children than her counterpart in Australia.
Life Expectancy

Life expectancy at birth – an estimate of the expected life span of an average newborn child – has been rising around the world. According to the United Nations, global life expectancy at birth increased from 48 years in the 1950 to 1955 period to 69 years in 2010-2015, and it is expected to continue to rise over the next four decades.24
People in many (though not all) countries are living longer due to increased access to healthcare, improvements in diet and hygiene, effective responses to infectious disease, and many other factors.
These developments in healthcare and living conditions, however, have not occurred uniformly around the world. As a result, life expectancy varies across the six regions in this study. At present, North America has the highest average life expectancy (79 years), followed closely by Europe (77) and Latin America and the Caribbean (75). Average life expectancies in the Middle East and North Africa (72) and the Asia-Pacific region (70) are slightly above the global average (69). Sub-Saharan Africa is the only region where average life expectancy (55 years) is below the global average.
By 2050, life expectancy at birth is projected to average 76 years around the world, an increase of about seven years from the current five-year period (2010-2015). All six geographic regions are expected to see a rise in their populations’ life expectancy over the coming decades. But regions and individual countries that have relatively high life expectancies in 2010-2015 are expected to make only modest gains compared with regions and individual countries where life expectancy, at present, is much lower. For example, North America is expected to see a five-year gain in life expectancy by 2050 – from 79 to 84 years. Sub-Saharan Africa, meanwhile, is projected to experience an increase in average life expectancy of 13 years, from 55 to 68 years.

Life expectancy is a significant factor in estimating the size of the world’s populations over time. Groups with higher life expectancies will, on average, live longer and (all else remaining equal) have larger populations. A higher share of young people who are alive today in Europe and North America are likely to be alive in 2050 compared with those residing in sub-Saharan Africa and the Asia-Pacific region.
At the same time, the greater-than-average increase in life expectancy that is projected in sub-Saharan Africa is one of the reasons its population is expanding so rapidly and boosting the global size of the region’s two biggest religious groups, Muslims and Christians.
Worldwide, little information is available on differences in life expectancy among religious groups within individual countries. In the absence of better data, the projections in this report assume that people in all religious groups have the average life expectancy of the country in which they live. For example, both Christians and Muslims in Nigeria are assigned the country’s average life expectancy for 2010-2015 (53 years), while both Christians and Muslims in the United Kingdom are assigned the U.K.’s average life expectancy for 2010-2015, which is 80 years.
Nevertheless, differences in life expectancy play an important role in the population growth projections. This is because the world’s major religious groups are concentrated in different countries, and some countries have much higher life expectancies than others.

For example, because of the countries in which Jews are concentrated, the global life expectancy at birth for Jews in the present five-year period (2010-2015) is estimated to be 80 years, the highest of any of the religious groups in this report. Other groups that are concentrated in countries where life expectancy at birth currently exceeds the global average (69 years) are the religiously unaffiliated (75 years), Buddhists (74 years), members of folk religions (73 years), followers of other religions (71 years) and Christians (71 years). By contrast, both Muslims (67 years) and Hindus (66 years) are concentrated in countries with relatively low life expectancy at birth.
In the 2050-2055 period, Jews still are projected to have the highest life expectancy of all the major religious groups, a global average of 85 years, five years longer than at present. But the greatest gains in longevity over the next four decades are expected among Hindus, whose global average life expectancy is projected to rise from 66 years in 2010-2015 to 75 years in 2050-2055.
Age Structure
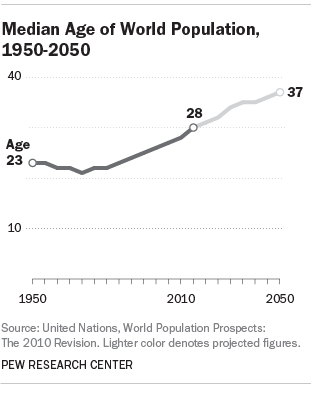
In the decades ahead, the world’s population will increase as people live longer. From 1950 until about 1980, the median age of the world’s population remained in the low 20s. By 2010, however, the median age of the population was 28 years. And by 2050, the global median age is expected to be 37, as declining fertility rates lead to relative stability in the number of young children and as the elderly population soars. The United Nations estimates that the number of people ages 100 and older will rise from about 150,000 in the year 2000 to more than 3 million in 2050.

A simple way to look at the age structure of the world’s population is to divide everyone into three age groups – children younger than 15, teens and adults between ages 15 and 59 and adults ages 60 and older. As of 2010, the largest group was the middle category (62%), and there were many more children (27%) than older adults (11%). But as the global population ages, this distribution will shift, particularly among the youngest and oldest cohorts. By 2050, according to U.N. projections, the share of people ages 60 and older (22%) will exceed the share under age 15 (20%).The youthfulness of a population is an important factor in future growth. All else being equal, a population that begins with a relatively large percentage of people who are in – or soon will enter – their prime childbearing years will grow faster than a population that begins with many people who are beyond their prime reproductive years. Moreover, growth propelled by a youthful population tends to carry into the next generation, as the younger cohort’s children reach maturity and begin to have babies of their own, creating a kind of demographic momentum.

Among the world’s major religious groups, Muslims had the highest concentration of children as of 2010 (34% of Muslims worldwide were under the age of 15), while Jews had the highest concentration of older adults (20% of Jews worldwide were 60 or older in 2010).

Globally, fewer than one-in-five religiously unaffiliated people (19%) were under the age of 15, the smallest share of children in any of the major religious groups in 2010. This reflects the geographic concentration of the unaffiliated in countries such as China and Japan, which have relatively old populations with low fertility rates.
For similar reasons, Buddhists also are an older population, with just 20% under age 15. By contrast, more than a quarter of Christians worldwide and three-in-ten Hindus were in the youngest age group as of 2010. This reflects the high fertility rates in recent decades among Christians in sub-Saharan Africa and Hindus in India.
For the purposes of projecting future growth, the number of women in their early reproductive years also is a key factor. As of 2010, 13% of the world’s population consisted of females between the ages of 15 and 29. Muslims were the only major religious group with a higher share of women in this category (14%) than the global average, yet another reason the Muslim population is poised for rapid growth in the coming decades. The religiously unaffiliated (11%) and Jews (10%) had the lowest shares of women ages 15-29 in their populations, as of 2010.
Religious Switching
In many countries, it is fairly common for adults to switch from identifying with the religion in which they grew up to identifying with another religion or with no religion.25 But only in recent decades have cross-national surveys begun to measure individual changes in religious identity.26 The broadest analysis of religious switching published in recent years examined just 40 countries, primarily in Europe, using data collected between 1991 and 2001.27
The projections in this report go further, showing what the future religious landscape may look like if switching continues at the same rates recently observed in 70 countries, which are spread throughout the world’s major regions.28 Data on these switching patterns come from surveys carried out between 2008 and 2013 by the Pew Research Center and other organizations, including studies carried out under the auspices of the International Social Survey Program. This collection of data provides the most comprehensive picture available to date of global patterns of switching among major religious groups, including from having been raised in a religion to being religiously unaffiliated as an adult.29
Levels of switching are different for men and women. But at the global level, net movement due to the religious switching of men and women follows similar patterns. The chart below shows the projected total amount of movement into and out of major religious groups between 2010 and 2050 for countries with data on switching.
The largest net movement is expected to be out of Christianity (66 million people), including the net departure of twice as many men (44 million) as women (22 million). Similarly, net gains among the unaffiliated (61 million) are projected to be more than twice as large for men (43 million) as for women (19 million). Muslims and followers of folk religions and other religions are expected to experience modest gains due to religious switching. Jews and Buddhists are expected to experience modest net losses through religious switching.

Regional Patterns

At the regional level, some patterns stand out. The largest projected net gains from switching between 2010 and 2050 are into the ranks of the unaffiliated, particularly in North America (26 million), Europe (24 million), Latin America (6 million) and the Asia-Pacific region (4 million). But in sub-Saharan Africa, the greatest net gains are expected for Muslims (3 million).
The largest net losses are expected among Christian populations, notably in North America (28 million), Europe (24 million), Latin America and the Caribbean (9 million) and sub-Saharan Africa (3 million). In the Asia-Pacific region, Christians are expected to have a net loss, due to religious switching, of more than 2 million adherents.
Alternative Scenarios: Seeing How Much Difference Switching Makes
Religious switching may have a large impact on the religious composition of individual countries. But over the 40-year horizon of these projections, it is expected to have only a modest effect on the global size of most religious groups.
The global impact of religious switching can be seen by comparing the main projection scenario used in this study, which models switching in 70 countries, with two hypothetical scenarios – one in which switching is modeled in a total of a 155 countries, and one that assumes no switching will occur anywhere.
In the main projection model used throughout this report, the 70 countries with documented switching data contain 42% of the world’s population, as of 2010. In the second scenario considered here, switching is projected in an additional 85 countries by using some of the initial 70 countries as proxies for switching patterns in similar, often neighboring, nations.30 For example, although no direct data on switching is available for Canada, one might assume that Canada is similar to the United States and therefore apply the same rates of switching observed in the U.S. to Canada’s population. Since the 85 additional countries account for about 10% of the world’s population, the second scenario models switching among a little more than half the people on Earth.
The third scenario assumes that no religious switching will take place from 2010 to 2050, meaning that every adult will remain in the group in which he or she was raised. All those raised as Christians will stay Christian, all those raised without a religion will stay unaffiliated, and so on. But this hypothetical “no switching” scenario, like the other two scenarios, takes into account all the other demographic drivers affecting the future size of religious groups: fertility rates, mortality rates, current age profiles and migration patterns.
The biggest differences in the outcome of these three scenarios are the size of the Christian and unaffiliated populations in 2050. The Christian share of the world’s population is greatest in the “no switching” scenario (32.3%), followed by the main scenario that models switching in 70 countries (31.4%). It is slightly lower (31.3%) in the scenario that models switching in 155 countries.
The unaffiliated share of the world’s population is lowest in 2050 (12.3%) in the scenario with no switching. When switching is modeled in 70 countries – the main scenario – 13.2% of the world’s population is projected to have no religious affiliation in 2050. When switching is modeled for an additional 85 countries using proxy data, the projections show 13.4% of the global population as religiously unaffiliated in 2050.
Comparing the outcomes of these three scenarios suggests that religious switching – at least at recently observed levels, in the limited number of countries for which data on switching are available – will have a relatively small impact on the projected size of major religious groups in 2050.
The biggest unknown factor, however, is China, the world’s most populous country. Because of a lack of reliable data on religious switching in China, none of the scenarios models religious switching among its 1.3 billion people. If there is considerable switching in China in the coming decades, it could lower the percentage of the world’s population that is unaffiliated and boost the numbers of Christians, Buddhists and perhaps other groups. (See sidebar on China at the end of this chapter.)


Migration
International migration has no immediate impact on the global size of religious groups. But, over time, migration can significantly change the religious makeup of individual countries and even entire regions. Europe, for example, has experienced an inflow of Muslims from North Africa, South Asia and Turkey over the past decade. And some of the Gulf Cooperation Council states, such as Qatar and the United Arab Emirates, have had substantial immigration of non-Muslims from Asia and beyond.31

Estimating future migration is challenging because the movement of people across borders is dependent on government policies and international events that can change quickly. And because many migrants follow economic opportunities, migration patterns also are dependent on changing economic conditions.
Nonetheless, it is possible to use data on past migration as a reasonable estimate for the future, just as past fertility and religious switching patterns are used in this report to model future fertility and switching.
The Pew Research Center, in collaboration with researchers at the International Institute for Applied Systems Analysis, has developed an innovative technique to estimate recent migration patterns and their religious breakdown. First, recent changes in the origins and destinations of migrants worldwide are estimated using census and survey data about the migrant population living in each country. Changes in this migrant “stock” data over the 2005 to 2010 period are used to estimate migrant “flows,” the number of people who moved between countries during this period, taking into account the slowing of migration in many parts of the world due to an economic downturn.32 Second, religious breakdowns of migrants based on data from the Pew Research Center’s Global Religion and Migration Database are applied to the origins and destinations of migrants. Finally, the religious breakdown of migrant flows is used to calculate migration rates into and out of most countries by religion, by sex and by five-year age groups. (For more detail on how future migration was projected, see the Methodology.)
Initial Effects of Migration, 2010-2015
Between 2010 and 2015, approximately 19 million people are expected to move across international borders. Most of them are either Christians or Muslims, the world’s two largest religious groups. Christian migrants who are projected to number nearly 9 million, or 46% of all international migrants between 2010 and 2015 are expected to come primarily from Latin America and the Caribbean and to move primarily to the United States. Muslim migrants, numbering about 6 million in total, are expected to come largely from the Asia-Pacific and Middle East-North Africa regions, migrating within those same regions as well as to Europe and North America.
Nearly 3 million migrants, or about 14% of the expected total between 2010 and 2015, are estimated to be Hindus, Buddhists, Jews, adherents of folk religions or members of other religious groups. About 2 million migrants (9%) are expected to have no religious affiliation.
As a result of these movements from one region to another, the Asia-Pacific region is projected to experience a net loss of approximately 2 million Muslims and 500,000 Hindus between 2010 and 2015. The Latin America-Caribbean region is likely to see a net loss of 3 million Christians from migration. And sub-Saharan Africa is projected to have a net loss of about 500,000 Christians and Muslims, combined.
However, the birth rates in these regions are relatively high, and their current populations are relatively young. Consequently, their total populations are projected to grow despite emigration, and the outflows are not likely to significantly change their religious makeup.
By contrast, net inflows of migrants are expected to have a substantial impact on the religious makeup of many countries in Europe, North America and the Middle East-North Africa region. For example, a net inflow of 1 million Muslims is projected to occur in Europe between 2010 and 2015. Smaller numerical gains from migration also are projected in Europe for both Buddhists and Hindus.
Religious minorities in North America also are expected to experience net gains from migration between 2010 and 2015, including Muslims (about 400,000), Hindus (about 200,000) and Buddhists (about 200,000). These religious groups are expected to come from all over the world, but primarily from Asia and the Pacific.
The Middle East-North Africa region is likely to see a net inflow of Hindus and Christians through migration, primarily to the oil-rich Gulf states. Hindus are expected to come principally from India and Nepal, while Christians are projected to come from the Philippines, other countries in Asia and the Pacific and Europe.
Seeing How Much Difference Migration Makes in the 2010-2050 Projections

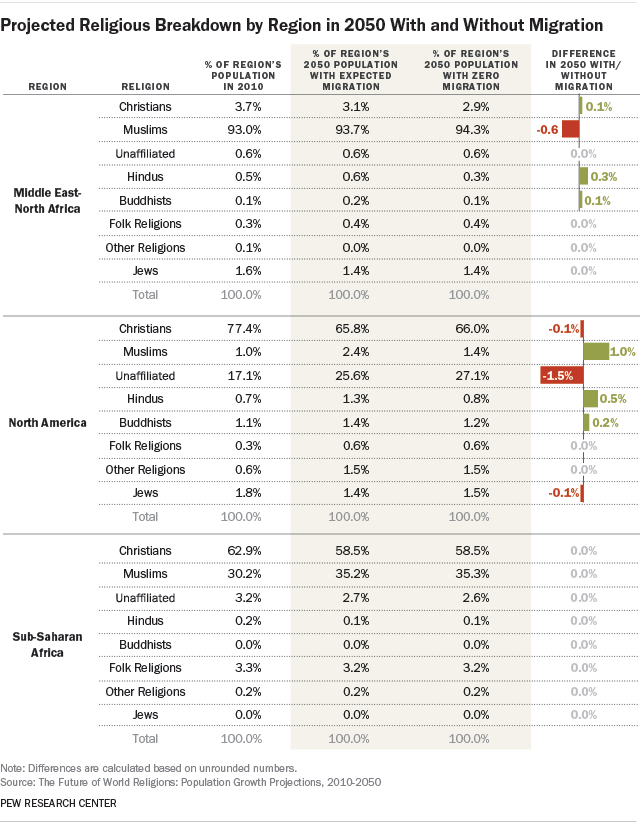
To see how much impact migration has on the projections, researchers compared the main projection scenario used in this report with an alternative scenario in which no international migration occurs after 2010.
The main projections in this report indicate that the share of Muslims in Europe’s population will nearly double between 2010 and 2050, from about 5.9% to 10.2%. A variety of factors, including higher birth rates and a bulging youth population among Muslims in Europe, underlie this expected increase. But immigration also plays a role. The projected share of Muslims in Europe in 2050 is nearly two percentage points higher than in the alternative scenario with no new migration. Indeed, about half (53%) of the projected growth of Europe’s Muslim population can be attributed to new migration.
In certain countries, the impact is even greater. Sweden’s population, for example, was 4.6% Muslim as of 2010; factoring in migration, that share is expected to more than double, to 12.4%, by 2050. In an alternative scenario involving no additional immigration to Sweden after 2010, the Muslim share of the population still would increase by 2050, but only to 6.8%. In addition to Sweden, the European countries in which migration is projected to make the biggest impact on the Muslim population – a difference of at least three percentage points – are Norway, Spain and the United Kingdom.
In North America, minority religious groups (including Muslims, Hindus, Buddhists, other religions and the unaffiliated) also are projected to grow, partly due to immigration. For example, Muslims are projected to make up 2.4% of North America’s population in 2050 when factoring in migration, but only 1.4% with no new migration. Similarly, the ranks of the religiously unaffiliated in North America are forecast to be 1.5 percentage points higher in a projection scenario that includes migration than in an alternative scenario that assumes zero migration from 2010 to 2050.
A few countries in the Asia-Pacific region are likely to experience religious change due to immigration. For example, Australia and New Zealand are projected to have slight increases in their non-Christian populations, as Muslims, Buddhists and Hindus continue moving to these two countries. Muslim and Christian populations are forecast to grow in economic hubs such as Hong Kong and Japan as immigrants belonging to these religious groups move from various countries in East Asia, including Indonesia and the Philippines. Meanwhile, the Hindu and Muslim shares of Singapore’s population are anticipated to grow significantly in the years ahead, mostly due to migration from India and Malaysia.
The Middle East-North Africa region also is expected to experience substantial religious change when immigration is factored into the projections, mostly due to anticipated migration to Gulf Cooperation Council (GCC) countries. The shares of Hindus and Buddhists are both projected to rise in these majority-Muslim countries; in fact, about 90% of Buddhist and Hindu growth in the region can be attributed to migration. Although migration is expected to boost the religious diversity of GCC countries, all the Gulf states are projected to retain Muslim majorities in 2050.
Religious change also can occur as a result of emigration, the movement of people out of a country or region. The departure of Christians from the Middle East-North Africa region, for example, lowers the projected share of Christians in places such as Egypt, Israel, Iraq, Jordan, Lebanon, the Palestinian territories and Syria.
But across the Middle East and North Africa as a whole, the emigration of Christians is expected to be offset by an influx of Christian immigrants in the Gulf Cooperation Council countries. Indeed, the net number of Christians entering GCC countries is expected to be about three times as large (1.5 million) as the net number of Christians leaving countries with historic Christian populations in the Middle East-North Africa region (about 500,000).

Emigration of smaller religious groups from some regions is expected to have a noticeable effect. For example, most of the projected decline in the number of Jews in Europe (from 1.4 million in 2010 to 1.2 million in 2050) and sub-Saharan Africa (from 100,000 in 2010 to 70,000 in 2050) can be attributed to Jewish emigration from these regions, mainly to Israel. And most of the expected decline of Hindus in Latin America and the Caribbean (from 660,000 in 2010 to 640,000 in 2050) is due to Hindu emigration out of the region, mainly to North America.

The Potential Impact of Religious Switching in China
With a population currently estimated at more than 1.3 billion, China could make a big difference in the global religious landscape during the coming decades. China now officially recognizes Buddhism, Islam, Taoism, as well as Protestants associated with the Protestant Three-Self Patriotic Movement and Catholics who are part of the Catholic Patriotic Association.33 Adherents of other religions, including Christians who worship in unregistered churches, may be reluctant to reveal their religious identity to officials or strangers. Measuring religious affiliation in China relies on imperfect surveys and other sources of data, including reports by official religious bodies, ethnic proxies (for Muslims), and estimates by religious groups operating in networks that are not approved by the Chinese government. Surveys that do exist, for instance, seem to underreport unregistered groups and Chinese folk religions in particular. Therefore, not only are current estimates only rough estimates, but reliable data on recent trends are unobtainable. Furthermore, in the past decade hundreds of millions of Chinese have moved from the countryside – where unregistered practice was reported by observers to be higher – to cities where religious networks may not have been transferred or replaced.34
There are no sources adequate to measure patterns of religious switching across China. This sidebar briefly reviews some of the challenges of measuring religion in China and provides an example of how religious switching in China could alter the global projections in this report.
While it is clear that religious affiliation and practice have risen dramatically in China since the end of the Cultural Revolution, data on recent patterns of religious switching are practically nonexistent35. Anecdotally, some newspaper articles and reports from religious groups have attempted to describe changes underway in China, but it is unclear how accurately these accounts reflect change underway at the country level.36 Still, some experts believe that China’s Christian population is growing, perhaps rapidly. Most notably, one of the world’s leading specialists on religion in China, Purdue University sociologist Fenggang Yang, estimates that the Christian population in China grew at an average annual rate of 7% between 1950 and 2010. At this rate, Yang calculates the proportion of China’s population that is Christian could grow from 5% in 2010 to 67% in 2050.37
Without survey data measuring patterns of switching among China’s main religious groups, it is not possible to formally model switching in China, as this report does for other countries.38 However, it is possible to conduct sensitivity tests that provide ballpark estimates of how much impact religious change in China could, potentially, have on the global religious landscape.
While all religious groups in China could be experiencing significant change through switching, media reports and expert assessments generally suggest that the main effects are rising numbers of Christians and declining numbers of religiously unaffiliated people. The following sensitivity tests assume, for illustrative purposes, that switching is limited to this movement between the unaffiliated and Christians.
As of 2010, China had an estimated 68 million Christians and 701 million unaffiliated people. Due primarily to differences in the age and sex composition of these initial populations, in the main projection scenario – which does not attempt to model religious switching – China’s Christian population is expected to grow slightly by 2050, to 71 million, while the unaffiliated population is expected to decline to 663 million.
Under that main scenario, 5.4% of China’s population and 31.4% of the world’s total population will be Christian in 2050. If China’s Christian population were to decline to Japanese levels (2.4% of the country’s population) in 2050, it would reduce the Christian share of the global population to 30.9%. On the other hand, if China’s Christian population was to increase to the level projected for South Korea in 2050 (33.3% of the country’s population), it would raise the count of Christians in China to 437 million and the share of Christians in the world’s overall population to 35.3%.
And if everyone who is currently unaffiliated in China were to convert to Christianity by 2050, China’s population would be 56.2% Christian (734 million Christians), raising the Christian share of the world’s population to 38.5% and lowering the unaffiliated share of the global population to 6.1%. Though that scenario may be unlikely, it offers a rough sense of how much difference religious switching in China maximally could have by 2050. Extremely rapid growth of Christianity in China could maintain or, conceivably, even increase Christianity’s current numerical advantage as the world’s largest religion, and it could significantly accelerate the projected decline by 2050 in the share of the global population that is religiously unaffiliated.