
The Christian share of the U.S. population is declining, while the number of U.S. adults who do not identify with any organized religion is growing, according to an extensive new survey by the Pew Research Center. Moreover, these changes are taking place across the religious landscape, affecting all regions of the country and many demographic groups. While the drop in Christian affiliation is particularly pronounced among young adults, it is occurring among Americans of all ages. The same trends are seen among whites, blacks and Latinos; among both college graduates and adults with only a high school education; and among women as well as men. (Explore the data with our interactive database tool.)
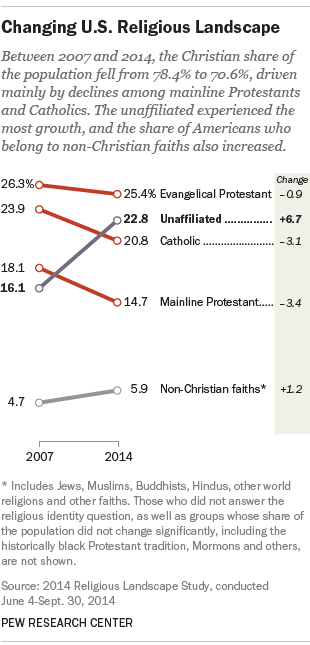
To be sure, the United States remains home to more Christians than any other country in the world, and a large majority of Americans – roughly seven-in-ten – continue to identify with some branch of the Christian faith.1 But the major new survey of more than 35,000 Americans by the Pew Research Center finds that the percentage of adults (ages 18 and older) who describe themselves as Christians has dropped by nearly eight percentage points in just seven years, from 78.4% in an equally massive Pew Research survey in 2007 to 70.6% in 2014. Over the same period, the percentage of Americans who are religiously unaffiliated – describing themselves as atheist, agnostic or “nothing in particular” – has jumped more than six points, from 16.1% to 22.8%. And the share of Americans who identify with non-Christian faiths also has inched up, rising 1.2 percentage points, from 4.7% in 2007 to 5.9% in 2014. Growth has been especially great among Muslims and Hindus, albeit from a very low base.
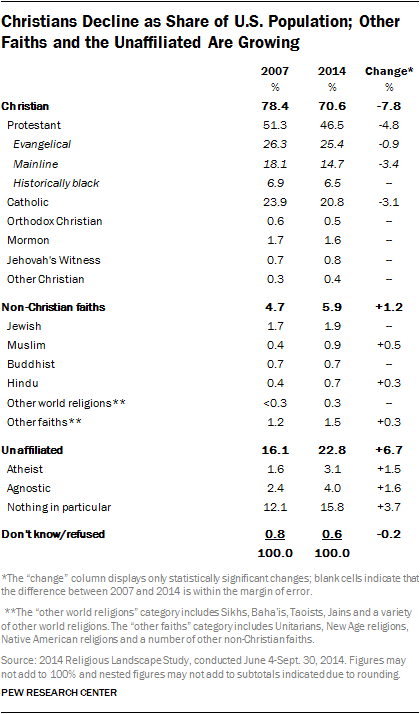
The drop in the Christian share of the population has been driven mainly by declines among mainline Protestants and Catholics. Each of those large religious traditions has shrunk by approximately three percentage points since 2007. The evangelical Protestant share of the U.S. population also has dipped, but at a slower rate, falling by about one percentage point since 2007.2
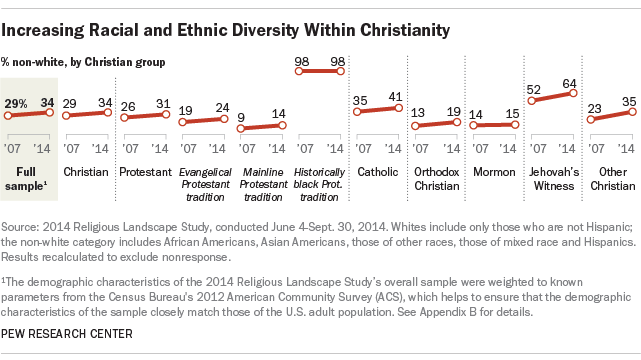
Even as their numbers decline, American Christians – like the U.S. population as a whole – are becoming more racially and ethnically diverse. Non-Hispanic whites now account for smaller shares of evangelical Protestants, mainline Protestants and Catholics than they did seven years earlier, while Hispanics have grown as a share of all three religious groups. Racial and ethnic minorities now make up 41% of Catholics (up from 35% in 2007), 24% of evangelical Protestants (up from 19%) and 14% of mainline Protestants (up from 9%).
Religious intermarriage also appears to be on the rise: Among Americans who have gotten married since 2010, nearly four-in-ten (39%) report that they are in religiously mixed marriages, compared with 19% among those who got married before 1960.3 The rise in intermarriage appears to be linked with the growth of the religiously unaffiliated population. Nearly one-in-five people surveyed who got married since 2010 are either religiously unaffiliated respondents who married a Christian spouse or Christians who married an unaffiliated spouse. By contrast, just 5% of people who got married before 1960 fit this profile.
Explore data on religious groups in the U.S. by affiliation, geographic and demographic information.
While many U.S. religious groups are aging, the unaffiliated are comparatively young – and getting younger, on average, over time. As a rising cohort of highly unaffiliated Millennials reaches adulthood, the median age of unaffiliated adults has dropped to 36, down from 38 in 2007 and far lower than the general (adult) population’s median age of 46.4 By contrast, the median age of mainline Protestant adults in the new survey is 52 (up from 50 in 2007), and the median age of Catholic adults is 49 (up from 45 seven years earlier).
These are among the key findings of the Pew Research Center’s second U.S. Religious Landscape Study, a follow-up to its first comprehensive study of religion in America, conducted in 2007.
Because the U.S. census does not ask Americans about their religion, there are no official government statistics on the religious composition of the U.S. public.5 Some Christian denominations and other religious bodies keep their own rolls, but they use widely differing criteria for membership and sometimes do not remove members who have fallen away.6 Surveys of the general public frequently include a few questions about religious affiliation, but they typically do not interview enough people, or ask sufficiently detailed questions, to be able to describe the country’s full religious landscape.
The Religious Landscape Studies were designed to fill the gap. Comparing two virtually identical surveys, conducted seven years apart, can bring important trends into sharp relief. In addition, the very large samples in both 2007 and 2014 included hundreds of interviews with people from small religious groups that account for just 1% or 2% of the U.S. population, such as Mormons, Episcopalians and Seventh-day Adventists. This makes it possible to paint demographic and religious profiles of numerous denominations that cannot be described by smaller surveys. The most recent Religious Landscape Study also was designed to obtain a minimum of 300 interviews with respondents in each state and the District of Columbia as well as to represent the country’s largest metropolitan areas, enabling an assessment of the religious composition not just of the nation as a whole, but also of individual states and localities. (See Appendix D.)
The latest survey was conducted in English and Spanish among a nationally representative sample of 35,071 adults interviewed by telephone, on both cellphones and landlines, from June 4-Sept. 30, 2014. Findings based on the full sample have a margin of sampling error of plus or minus 0.6 percentage points. The survey is estimated to cover 97% of the non-institutionalized U.S. adult population; 3% of U.S. adults are not reachable by telephone or do not speak English or Spanish well enough to participate in the survey. (See Appendix A for more information on how the survey was conducted, margins of error for subgroups analyzed in this report and additional details.)
Even a very small margin of error, when applied to the hundreds of millions of people living in the United States, can yield a wide range of estimates for the size of particular faiths. Nevertheless, the results of the second Religious Landscape Study indicate that Christians probably have lost ground, not only in their relative share of the U.S. population, but also in absolute numbers.
In this study, respondents’ religious affiliation (also sometimes referred to as “religious identity”) is based on self-reports. Catholics, for instance, are defined as all respondents who say they are Catholic, regardless of their specific beliefs and whether or not they attend Mass regularly.
The terms “unaffiliated” and “religious ‘nones’” are used interchangeably throughout this report. This group includes self-identified atheists and agnostics as well as those who describe their religion as “nothing in particular.”
The unaffiliated are generally less religiously observant than people who identify with a religion. But not all religious “nones” are nonbelievers. In fact, many people who are unaffiliated with a religion believe in God, pray at least occasionally and think of themselves as spiritual people. Forthcoming reports will describe the Religious Landscape Study’s findings about the religious beliefs and practices of “nones” and other groups.
For more details on the exact questions used to measure religious identity, see the survey topline. For more on how Protestant respondents were grouped into particular religious traditions, see Appendix B.
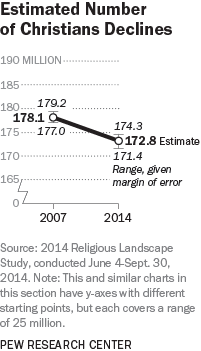
In 2007, there were 227 million adults in the United States, and a little more than 78% of them – or roughly 178 million – identified as Christians. Between 2007 and 2014, the overall size of the U.S. adult population grew by about 18 million people, to nearly 245 million.7 But the share of adults who identify as Christians fell to just under 71%, or approximately 173 million Americans, a net decline of about 5 million.
This decline is larger than the combined margins of sampling error in the twin surveys conducted seven years apart. Using the margins of error to calculate a probable range of estimates, it appears that the number of Christian adults in the U.S. has shrunk by somewhere between 2.8 million and 7.8 million.8
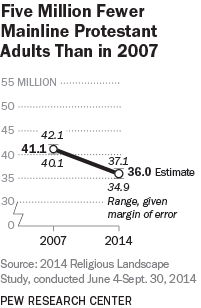
Of the major subgroups within American Christianity, mainline Protestantism – a tradition that includes the United Methodist Church, the American Baptist Churches USA, the Evangelical Lutheran Church in America, the Presbyterian Church (U.S.A.) and the Episcopal Church, among others – appears to have experienced the greatest drop in absolute numbers. In 2007, there were an estimated 41 million mainline Protestant adults in the United States. As of 2014, there are roughly 36 million, a decline of 5 million – although, taking into account the surveys’ combined margins of error, the number of mainline Protestants may have fallen by as few as 3 million or as many as 7.3 million between 2007 and 2014.9
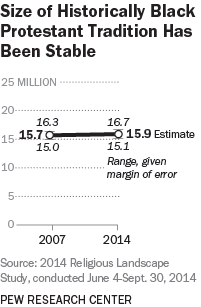
By contrast, the size of the historically black Protestant tradition – which includes the National Baptist Convention, the Church of God in Christ, the African Methodist Episcopal Church, the Progressive Baptist Convention and others – has remained relatively stable in recent years, at nearly 16 million adults. And evangelical Protestants, while declining slightly as a percentage of the U.S. public, probably have grown in absolute numbers as the overall U.S. population has continued to expand.
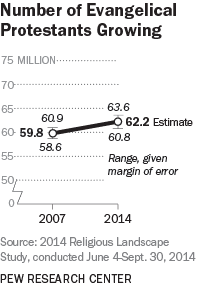
The new survey indicates that churches in the evangelical Protestant tradition – including the Southern Baptist Convention, the Assemblies of God, Churches of Christ, the Lutheran Church-Missouri Synod, the Presbyterian Church in America, other evangelical denominations and many nondenominational congregations – now have a total of about 62 million adult adherents. That is an increase of roughly 2 million since 2007, though once the margins of error are taken into account, it is possible that the number of evangelicals may have risen by as many as 5 million or remained essentially unchanged.10
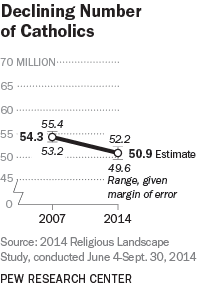
Like mainline Protestants, Catholics appear to be declining both as a percentage of the population and in absolute numbers. The new survey indicates there are about 51 million Catholic adults in the U.S. today, roughly 3 million fewer than in 2007. But taking margins of error into account, the decline in the number of Catholic adults could be as modest as 1 million.11 And, unlike Protestants, who have been decreasing as a share of the U.S. public for several decades, the Catholic share of the population has been relatively stable over the long term, according to a variety of other surveys (see Appendix C).
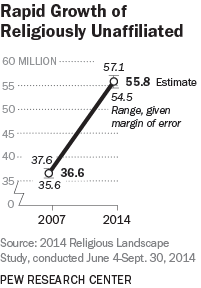
Meanwhile, the number of religiously unaffiliated adults has increased by roughly 19 million since 2007. There are now approximately 56 million religiously unaffiliated adults in the U.S., and this group – sometimes called religious “nones” – is more numerous than either Catholics or mainline Protestants, according to the new survey. Indeed, the unaffiliated are now second in size only to evangelical Protestants among major religious groups in the U.S.
Factors Behind the Changes in Americans’ Religious Identification
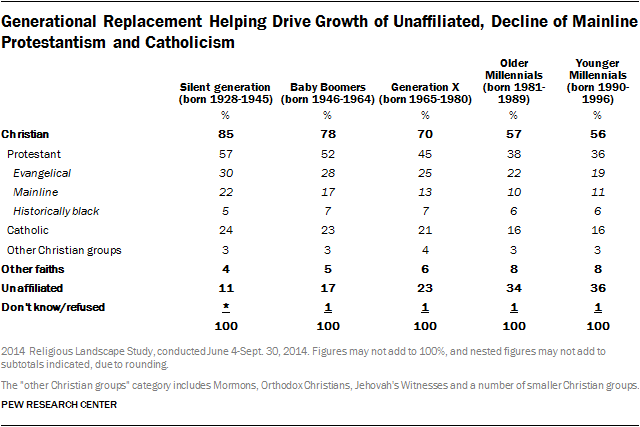
One of the most important factors in the declining share of Christians and the growth of the “nones” is generational replacement. As the Millennial generation enters adulthood, its members display much lower levels of religious affiliation, including less connection with Christian churches, than older generations. Fully 36% of young Millennials (those between the ages of 18 and 24) are religiously unaffiliated, as are 34% of older Millennials (ages 25-33). And fewer than six-in-ten Millennials identify with any branch of Christianity, compared with seven-in-ten or more among older generations, including Baby Boomers and Gen-Xers. Just 16% of Millennials are Catholic, and only 11% identify with mainline Protestantism. Roughly one-in-five are evangelical Protestants.
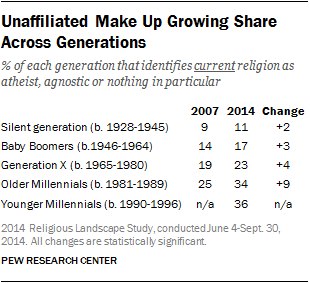
However, generational replacement is by no means the only reason that religious “nones” are growing and Christians are declining. In addition, people in older generations are increasingly disavowing association with organized religion. About a third of older Millennials (adults currently in their late 20s and early 30s) now say they have no religion, up nine percentage points among this cohort since 2007, when the same group was between ages 18 and 26. Nearly a quarter of Generation Xers now say they have no particular religion or describe themselves as atheists or agnostics, up four points in seven years. Baby Boomers also have become slightly but noticeably more likely to identify as religious “nones” in recent years.
As the shifting religious profiles of these generational cohorts suggest, switching religion is a common occurrence in the United States. If all Protestants were treated as a single religious group, then fully 34% of American adults currently have a religious identity different from the one in which they were raised. This is up six points since 2007, when 28% of adults identified with a religion different from their childhood faith. If switching among the three Protestant traditions (e.g., from mainline Protestantism to the evangelical tradition, or from evangelicalism to a historically black Protestant denomination) is added to the total, then the share of Americans who currently have a different religion than they did in childhood rises to 42%.
By a wide margin, religious “nones” have experienced larger gains through religious switching than any other group. Nearly one-in-five U.S. adults (18%) were raised in a religious faith and now identify with no religion. Some switching also has occurred in the other direction: 9% of American adults say they were raised with no religious affiliation, and almost half of them (4.3% of all U.S. adults) now identify with some religion. But for every person who has joined a religion after having been raised unaffiliated, there are more than four people who have become religious “nones” after having been raised in some religion. This 1:4 ratio is an important factor in the growth of the unaffiliated population.
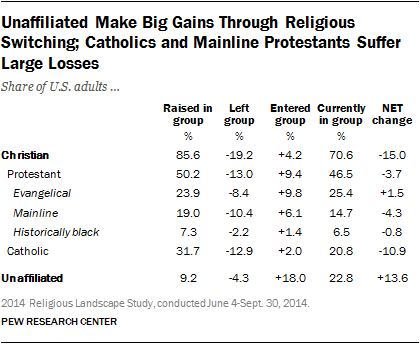
By contrast, Christianity – and especially Catholicism – has been losing more adherents through religious switching than it has been gaining. More than 85% of American adults were raised Christian, but nearly a quarter of those who were raised Christian no longer identify with Christianity. Former Christians represent 19.2% of U.S. adults overall.
Both the mainline and historically black Protestant traditions have lost more members than they have gained through religious switching, but within Christianity the greatest net losses, by far, have been experienced by Catholics. Nearly one-third of American adults (31.7%) say they were raised Catholic. Among that group, fully 41% no longer identify with Catholicism. This means that 12.9% of American adults are former Catholics, while just 2% of U.S. adults have converted to Catholicism from another religious tradition. No other religious group in the survey has such a lopsided ratio of losses to gains.
The evangelical Protestant tradition is the only major Christian group in the survey that has gained more members than it has lost through religious switching. Roughly 10% of U.S. adults now identify with evangelical Protestantism after having been raised in another tradition, which more than offsets the roughly 8% of adults who were raised as evangelicals but have left for another religious tradition or who no longer identify with any organized faith.
Other highlights in this report include:
- The Christian share of the population is declining and the religiously unaffiliated share is growing in all four major geographic regions of the country. Religious “nones” now constitute 19% of the adult population in the South (up from 13% in 2007), 22% of the population in the Midwest (up from 16%), 25% of the population in the Northeast (up from 16%) and 28% of the population in the West (up from 21%). In the West, the religiously unaffiliated are more numerous than Catholics (23%), evangelicals (22%) and every other religious group.
- Whites continue to be more likely than both blacks and Hispanics to identify as religiously unaffiliated; 24% of whites say they have no religion, compared with 20% of Hispanics and 18% of blacks. But the religiously unaffiliated have grown (and Christians have declined) as a share of the population within all three of these racial and ethnic groups.
- The percentage of college graduates who identify with Christianity has declined by nine percentage points since 2007 (from 73% to 64%). The Christian share of the population has declined by a similar amount among those with less than a college education (from 81% to 73%). Religious “nones” now constitute 24% of all college graduates (up from 17%) and 22% of those with less than a college degree (up from 16%).
- More than a quarter of men (27%) now describe themselves as religiously unaffiliated, up from 20% in 2007. Fewer women are religious “nones,” but the religiously unaffiliated are growing among women at about the same rate as among men. Nearly one-in-five women (19%) now describe themselves as religiously unaffiliated, up from 13% in 2007.
- Although it is low relative to other religious groups, the retention rate of the unaffiliated has increased. In the current survey, 53% of those raised as religiously unaffiliated still identify as “nones” in adulthood, up seven points since 2007. And among Millennials, “nones” actually have one of the highest retention rates of all the religious categories that are large enough to analyze in the survey.
- As the ranks of the religiously unaffiliated continue to grow, they also describe themselves in increasingly secular terms. In 2007, 25% of the “nones” called themselves atheists or agnostics; 39% identified their religion as “nothing in particular” and also said that religion is “not too” or “not at all” important in their lives; and 36% identified their religion as “nothing in particular” while nevertheless saying that religion is either “very important” or “somewhat important” in their lives. The new survey finds that the atheist and agnostic share of the “nones” has grown to 31%. Those identifying as “nothing in particular” and describing religion as unimportant in their lives continue to account for 39% of all “nones.” But the share identifying as “nothing in particular” while also affirming that religion is either “very” or “somewhat” important to them has fallen to 30% of all “nones.”
- While the mainline Protestant share of the population is significantly smaller today than it was in 2007, the evangelical Protestant share of the population has remained comparatively stable (ticking downward slightly from 26.3% to 25.4% of the population). As a result, evangelicals now constitute a clear majority (55%) of all U.S. Protestants. In 2007, roughly half of Protestants (51%) identified with evangelical churches.
- Since 2007, the share of evangelical Protestants who identify with Baptist denominations has shrunk from 41% to 36%. Meanwhile, the share of evangelicals identifying with nondenominational churches has grown from 13% to 19%.
- The United Methodist Church (UMC) continues to be the largest denomination within the mainline Protestant tradition. Currently, 25% of mainline Protestants identify with the UMC, down slightly from 28% in 2007.
- More than six-in-ten people in the historically black Protestant tradition identify with Baptist denominations, including 22% who identify with the National Baptist Convention, the largest denomination within the historically black Protestant tradition.
- The share of the public identifying with religions other than Christianity has grown from 4.7% in 2007 to 5.9% in 2014. Gains were most pronounced among Muslims (who accounted for 0.4% of respondents in the 2007 Religious Landscape Study and 0.9% in 2014) and Hindus (0.4% in 2007 vs. 0.7% in 2014).12
- Roughly one-in-seven participants in the new survey (15%) were born outside the U.S., and two-thirds of those immigrants are Christians, including 39% who are Catholic. More than one-in-ten immigrants identify with a non-Christian faith, such as Islam or Hinduism.
- Hindus and Jews continue to be the most highly educated religious traditions. Fully 77% of Hindus are college graduates, as are 59% of Jews (compared with 27% of all U.S. adults). These groups also have above-average household incomes. Fully 44% of Jews and 36% of Hindus say their annual family income exceeds $100,000, compared with 19% of the public overall.
About the 2014 U.S. Religious Landscape Study
This is the first report on findings from the 2014 U.S. Religious Landscape Study, the centerpiece of which is a nationally representative telephone survey of 35,071 adults. This is the second time the Pew Research Center has conducted a Religious Landscape Study. The first was conducted in 2007, also with a telephone survey of more than 35,000 Americans.
The new study is designed to serve three main purposes:
- To provide a detailed account of the size of the religious groups that populate the U.S. landscape;
- To describe the demographic characteristics, religious beliefs and practices, and social and political values of those religious groups; and
- To document how the religious profile of the U.S. has changed since the first study was conducted in 2007. With more than 35,000 interviews each, both the 2007 and 2014 studies have margins of error of less than one percentage point, making it possible to identify even relatively small changes in religious groups’ share of the U.S. population.
The results of the 2014 Religious Landscape Study will be published in a series of reports over the coming year. This first report focuses on the changing religious composition of the U.S. and describes the demographic characteristics of U.S. religious groups, including their median age, racial and ethnic makeup, nativity data, education and income levels, gender ratios, family composition (including religious intermarriage rates) and geographic distribution. It also summarizes patterns in religious switching.
In addition, this report includes an appendix that compares the findings of the 2007 and 2014 Religious Landscape Studies with several other surveys and assesses how recent developments in American religion fit into longer-term trends. Data from a variety of national surveys, including the long-running General Social Survey and Gallup polls, confirm that Protestants have been declining as a share of the U.S. population and that the unaffiliated have been growing. But there is less of a consensus about trends in American Catholicism. Some surveys, including the one featured in this report, indicate that the Catholic share of the population is declining, while others suggest it is relatively stable or may have declined and then ticked back up in recent years. (See Appendix C.)
Other findings from the 2014 Religious Landscape Study will be released later this year. In addition to the written reports, the Religious Landscape Study’s findings will be available through a new interactive tool. The online presentation allows users to delve more deeply into the survey’s findings, build interactive maps or charts and explore the data most interesting to them.
Acknowledgments
Many individuals from the Pew Research Center contributed to this report. Alan Cooperman, director of religion research, oversaw the effort and served as the primary editor. Gregory Smith, associate director for religion research, served as the primary researcher and wrote the Overview and Methodology. Smith also wrote the chapter on the changing religious composition of the U.S., the appendix on the classification of Protestant denominations and the appendix on putting the findings from the Religious Landscape Study into context. The chapter on religious switching and intermarriage was written by Research Associate Becka Alper. Research Associate Jessica Martinez and Research Assistant Claire Gecewicz wrote the chapter on the demographic profiles of religious groups, and Research Analyst Elizabeth Sciupac wrote the chapter on the shifting religious identity of demographic groups. Gecewicz prepared the detailed tables. The report was number checked by Alper, Gecewicz, Martinez, Sciupac and Research Associate Besheer Mohamed. The report was edited by Sandra Stencel, Michael Lipka, Caryle Murphy and Aleksandra Sandstrom. Bill Webster created the graphics. Stacy Rosenberg, Russell Heimlich, Diana Yoo, Besheer Mohamed, Ben Wormald and Juan Carlos Esparza Ochoa developed the interactive tool.
The Pew Research Center’s methods team provided advice on the sampling plan, questionnaire design, weighting strategy and data analysis. The methods team, led by Director of Survey Research Scott Keeter, includes Research Methodologists Kyley McGeeney and Andrew Mercer, Research Assistant Nicholas Hatley and graduate student intern H. Yanna Yan.
Others at the Pew Research Center who provided research guidance include Michael Dimock, Claudia Deane, Andy Kohut and Conrad Hackett. Communications support was provided by Katherine Ritchey, Stefan Cornibert, Russ Oates and Robyn Tomlin.
John C. Green, director of the Ray C. Bliss Institute of Applied Politics at the University of Akron, served as a senior adviser on the Religious Landscape Studies, providing valuable advice on the survey questionnaires, categorization of respondents and drafts of the reports. Additionally, we received helpful comments on portions of the 2014 study from David E. Campbell, director, Rooney Center for the Study of American Democracy, University of Notre Dame; William D’Antonio, senior fellow, Institute for Policy Research and Catholic Studies, The Catholic University of America; Mike Hout, professor of sociology, New York University; and Barry Kosmin, director, Institute for the Study of Secularism in Society and Culture, Trinity College. We also received valuable advice from Luis Lugo, former director of the Pew Research Center’s Religion & Public Life project, and Paul Taylor, former executive vice president of the Pew Research Center.
Funding for the 2014 Religious Landscape Study comes from The Pew Charitable Trusts, which received generous support for the project from the Lilly Endowment Inc.
While the analysis was guided by our consultations with the advisers, the Pew Research Center is solely responsible for the interpretation and reporting of the data.
Roadmap to the Report
The remainder of this report explores in greater depth many of the key findings summarized in this Overview. Chapter 1 offers a detailed look at the religious composition of the United States and how it has changed in recent years. Chapter 2 examines patterns in religious switching and intermarriage. Chapter 3 provides a demographic profile of the major religious traditions in the United States. Chapter 4 then flips the lens, looking at the religious profile of Americans in various demographic groups. Appendix A describes the methodology used to conduct the study. Appendix B provides details on how Protestants were categorized into one of three major Protestant traditions (the evangelical tradition, the mainline tradition and the historically black Protestant tradition) based on the specific denomination with which they identify. Appendix C compares findings from the Religious Landscape Studies with other major religion surveys and puts the current results into the context of longer-term trends.


