The U.S. population is undergoing a variety of demographic changes. For example, racial and ethnic diversity has been increasing as non-Hispanic whites have declined as a share of the population. And the share of adults who are married has been declining for decades. These broader changes are reflected within many of the major religious groups in the U.S. Since 2007, most religious groups have exhibited a decline in the non-Hispanic white share of their populations and a rise in the Hispanic share. And marriage rates are down among several religious groups.
Nonetheless, there is some variation among religious groups in the direction and magnitude of demographic changes. For instance, while the evangelical and mainline Protestant traditions have become somewhat more racially diverse, the share of Mormons who are non-Hispanic whites has hardly budged. Hispanics constitute a greater share of the Catholic population than of any other religious group; fully one-third of U.S. Catholic adults are Hispanics.
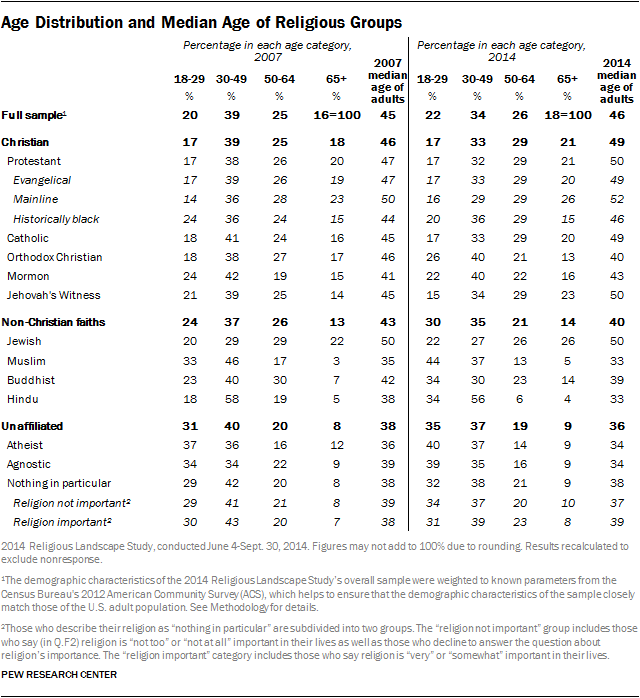
The data also show that religious groups that are growing tend to be younger than average and getting younger, while religious groups that are shrinking tend to be relatively old and getting older.
This chapter provides a detailed account of the demographic composition of religious groups in the U.S., highlighting both how religious groups are changing demographically and how they are staying the same. The next chapter examines demographics and religion from the opposite direction, describing the religious composition of various social and demographic groups.
Age Differences Among Religious Groups
The religious groups that are growing tend to be relatively young and getting younger, whereas the religious groups that are shrinking tend to be relatively old and getting older. The median age of religiously unaffiliated adults, for example, now stands at 36, down from 38 in 2007. Among self-identified atheists and agnostics, the median age is 34, and roughly four-in-ten adults in these categories are between the ages of 18 and 29. Muslims and Hindus also stand out for their comparative youthfulness; the median age of adults in each group is 33.
By contrast, the median age of Christian adults is 49, up from 46 in 2007. One-in-five Christians (21%) have reached the traditional retirement age of 65, compared with just 9% of the religiously unaffiliated, 5% of Muslims and 4% of Hindus.
Jews have a median age of 50, the same as in 2007 and on par with Catholics and Protestants as a whole.
Race and Ethnicity of Religious Groups
As the United States has become more racially and ethnically diverse in recent years – with fewer whites (as a share of the population) and more Hispanics and other racial and ethnic minorities – so, too, have the racial and ethnic profiles of many religious groups become more diverse. Whites now account for smaller shares of the evangelical, mainline Protestant, Catholic and religiously unaffiliated populations than they did in 2007, while Hispanics have grown as a share of all of these groups.
Hispanics make up a larger share of the U.S. Catholic population than they do of almost any other religious group. About one-third of Catholics are Hispanic (34%), up from 29% in 2007. And the data suggest that the Hispanic share of the Catholic population is likely to continue to grow at a rapid pace, since Hispanic Catholics are far younger, on average, than non-Hispanic Catholics. The median age of Hispanic Catholic adults is 42, while the median age of non-Hispanic Catholics is 53. And among Catholic Millennials, there are about as many Hispanics as whites. Among older generations of Catholics, there are more whites than Hispanics.19
Several religious traditions, including the historically black Protestant tradition, Jehovah’s Witnesses, Muslims, Buddhists and Hindus, are composed mostly of racial and ethnic minorities.
Two-thirds of religiously unaffiliated adults are white. This includes more than three-quarters of self-identified atheists (78%) and agnostics (79%), as well as 72% of those who say their religion is “nothing in particular” and who further state that religion is unimportant in their lives. By comparison, those who describe their religion as “nothing in particular” but who say religion is at least somewhat important in their lives are much more racially diverse.

Religion and Immigration
Fully 96% of Hindus in the U.S. are either immigrants (87%) or the children of immigrants (9%), as are nearly eight-in-ten Muslims (61% immigrants and 17% the children of immigrants). The vast majority of Hindus in the U.S. – 78% – were born in the Asia-Pacific region (India is home to by far the world’s largest Hindu population). Muslim immigrants come from many places around the world, including 27% who were born in the Asia-Pacific region, 12% who were born in the Middle East and North Africa and 12% who were born in sub-Saharan Africa.20
Among Christian groups, the Orthodox tradition is most heavily made up of immigrants and the children of immigrants. Four-in-ten Orthodox Christians were born outside the U.S. (including 20% who were born in Europe, 7% who were born in sub-Saharan Africa and 7% who are from the Asia-Pacific region); 23% of Orthodox Christians are the children of immigrants. More than four-in-ten Catholics are either first-generation (27%) or second-generation (15%) Americans. Most Catholic immigrants were born in the Americas (including Latin America and the Caribbean, as well as Canada).21

Educational Attainment and Income of Religious Groups
Hindus and Jews continue to be among the most highly educated religious groups in the U.S., just as they were when the 2007 Religious Landscape Study was conducted. Most adults in each group have at least a bachelor’s degree (77% of Hindus and 59% of Jews). And nearly half of Hindus (48%) and one-third of Jews (31%) have earned a post-graduate degree.
U.S. Muslims, Buddhists and Orthodox Christians also have relatively high levels of educational attainment, with roughly four-in-ten or more in each group having completed college. Atheists and agnostics have high levels of education as well, with 43% of self-identified atheists and 42% of agnostics saying they have completed college. Others within the religiously unaffiliated category are not as highly educated; 30% of those who describe their religion as “nothing in particular” and say religion is unimportant in their lives report having attained a bachelor’s degree, along with 16% of those who say their religion is “nothing in particular” and that religion is at least somewhat important to them.
A quarter of Catholics have completed college (26%), as have a similar share of Protestants (24%). Mainline Protestants are much more likely than their counterparts in the evangelical and historically black Protestant traditions to have completed college.

Differences in income across religious traditions largely mirror the differences in educational attainment. Jews and Hindus are among the groups most likely to report an annual household income of $100,000 or more (44% of Jews and 36% of Hindus). By contrast, large shares of members of the historically black Protestant tradition (53%), Jehovah’s Witnesses (48%) and people who say their religion is “nothing in particular” but that religion is at least somewhat important in their lives (47%) report household incomes of under $30,000 a year.
Catholics and Protestants overall largely mirror the U.S. general public in their income levels, though Protestants in the mainline tradition are somewhat more well-off by this measure than are their counterparts in the evangelical and historically black Protestant traditions.
Atheists and agnostics tend to be relatively wealthy, with about six-in-ten in each group making $50,000 or more per year. By contrast, those who describe their religion as “nothing in particular” and who say religion is unimportant to them closely mirror the population as a whole, while those who say their religion is “nothing in particular” but that religion is at least somewhat important to them tend to have below-average family incomes.

Gender Composition of Religious Groups
As in 2007, women continue to make up more than half of nearly every Christian group. Roughly two-thirds of Jehovah’s Witnesses are women, as are 59% of those who identify with the historically black Protestant tradition, 55% of those in both the evangelical and mainline Protestant traditions and 54% of Catholics and Mormons.
Most religiously unaffiliated adults, by contrast, are men. Fully two-thirds of self-identified atheists are men, as are 62% of agnostics and 55% of those who identify religiously as “nothing in particular” and further say that religion is unimportant in their lives. Among those who describe their religion as “nothing in particular” but say that religion is at least somewhat important in their lives, however, there are about as many women as men.

Marital Status and Family Size of Religious Groups
Since the first Religious Landscape Study was conducted in 2007, the share of Americans who are married has continued to decline, while the share of adults who have never been married has risen sharply. In fact, recent analysis of census data shows that the share of Americans who have never been married now stands at an all-time high.
These trends are evident across several religious groups. The share of evangelical Protestants, Catholics and religiously unaffiliated respondents who are married declined noticeably between 2007 and 2014.
Mormons continue to be among the groups most likely to be married. Compared with most other religious groups, there are fewer married people in the historically black Protestant tradition and among the religiously unaffiliated.

Just as they are more likely than people in most other faiths to be married, Mormons also tend to have larger families than do people in other religious groups. Mormons between the ages of 40 and 59 have had an average of 3.4 children over the course of their lives, significantly above the national average of 2.1 children. Mormons also report that they are currently raising more children than are members of most other religious groups. On average, Mormon adults of all ages report that they are now living with 1.1 children to whom they are parent or guardian.22
By contrast, the unaffiliated tend to have smaller families than other groups. Religious “nones” between the ages of 40 and 59 have had an average of 1.7 children during their lives. Atheists have had an average of 1.6 children, and agnostics have had 1.3 children. Mainline Protestants also have below-average fertility rates.

Regional Distribution of Religious Groups
Some religious groups are disproportionately concentrated in certain areas of the country, while others tend to be more evenly distributed across geographic regions. Large shares of Protestants in all three major traditions live in the South, including a majority of those in the historically black Protestant tradition (62%), about half of evangelicals (49%) and a plurality of mainline Protestants (37%). A plurality of Jews live in the Northeast (42%).
Mormons are heavily concentrated in the West, though the share of Mormons in the current survey who reside in the West is down somewhat since 2007 (from 76% to 67%). The change, however, does not seem to be the result of large-scale movement of Mormons from the West to other regions. In fact, Mormons are virtually unchanged since 2007 as a share of the population in the Northeast, Midwest and South. Rather, the change is produced by a slight decline in the share of Westerners who identify as Mormons, from just under 6% in 2007 to just under 5% in 2014. Even such a small decline can result in a large change in the geographic distribution of a relatively small religious group, especially one that is heavily concentrated in a single geographic region. Future surveys will determine whether this small decline in the Mormon share of the Western population is the beginning of a trend or merely an outlier.


Compared with some other religious groups, Catholics are more evenly dispersed throughout the country, with about one-in-five living in the Midwest (21%) and a quarter or more in the Northeast (26%), South (27%) and West (26%). The geographic center of Catholicism is shifting gradually from the Northeast and Midwest toward the South and West. In 2007, a slim majority of Catholics (53%) resided in the Northeast or Midwest. Today, a slim majority of Catholics live in the South or West (52%). This shift is being driven by the continuing growth of Hispanics as a share of the U.S. Catholic population; three-quarters of Hispanic Catholics reside in the South or West, while six-in-ten non-Hispanic Catholics live in the Northeast or Midwest.


