
Jews have the highest number of years of schooling, on average
Average years of formal schooling
Jews
13.4 years
Christians
9.3
Unaffiliated
8.8
Buddhists
7.9
Muslims
5.6
7.7 years
global avg
Hindus
5.6
Note: Adults ages 25 years and older
as of 2010 (or latest year available).
Source: Pew Research Center analysis.
See Methodology for more details.
“Religion and Education Around the World”
PEW RESEARCH CENTER
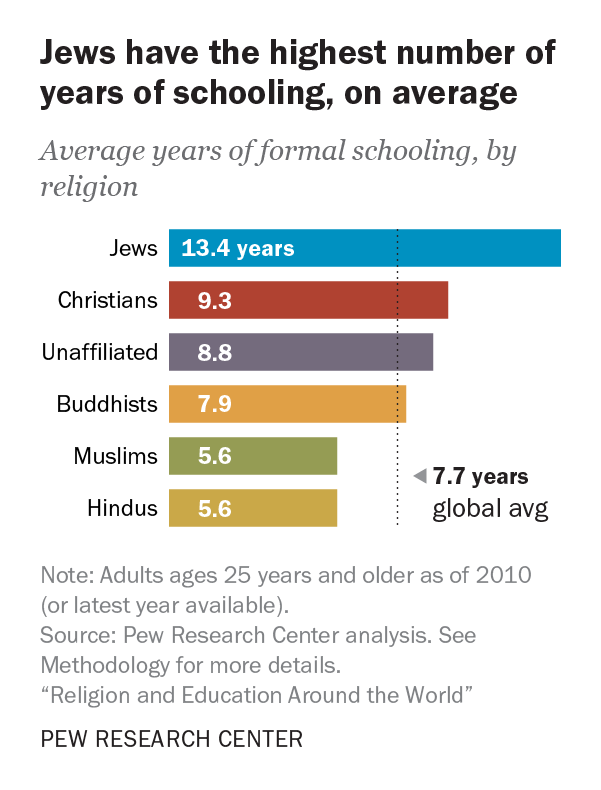
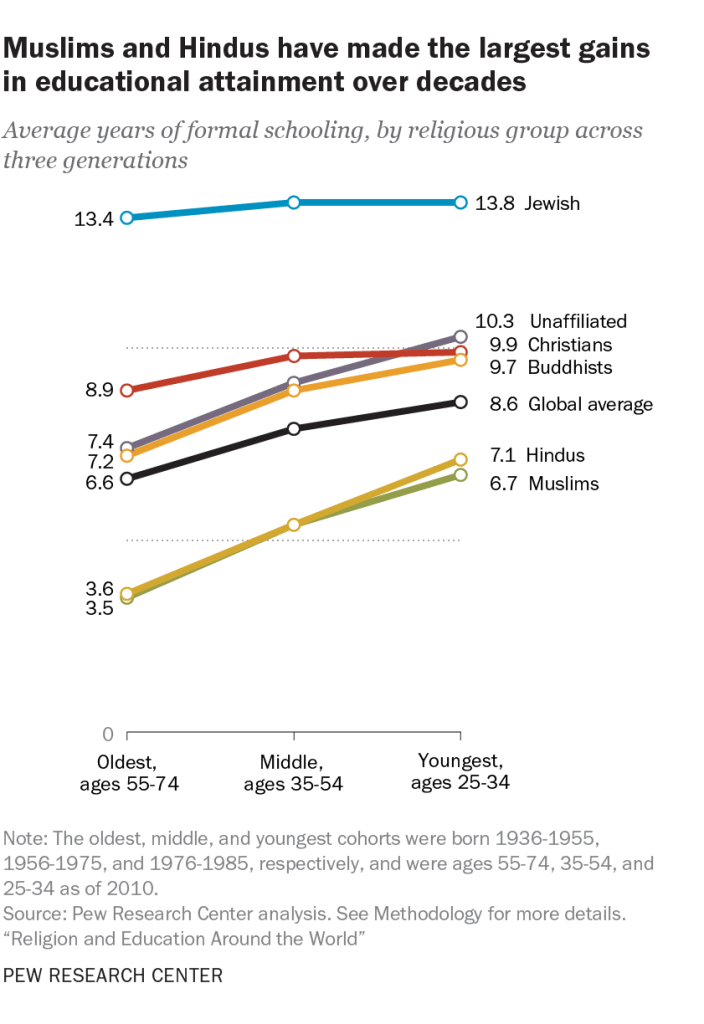
According to a new Pew Research Center global demographic study on differences in educational attainment among the world’s major religious groups, Jews are the most highly educated, with an average of more than 13 years of schooling (among those ages 25 and older). Christians, Buddhists and religiously unaffiliated people – who include atheists, agnostics and those who say their religion is nothing in particular – each have a higher number of years of schooling than the global average (7.7 years), while Muslims and Hindus have the fewest average years of schooling.

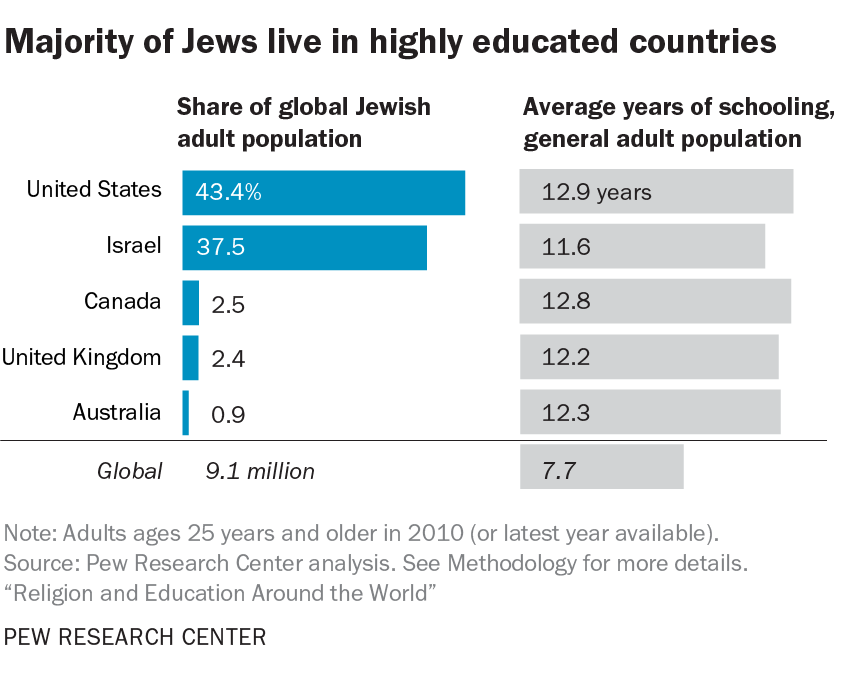
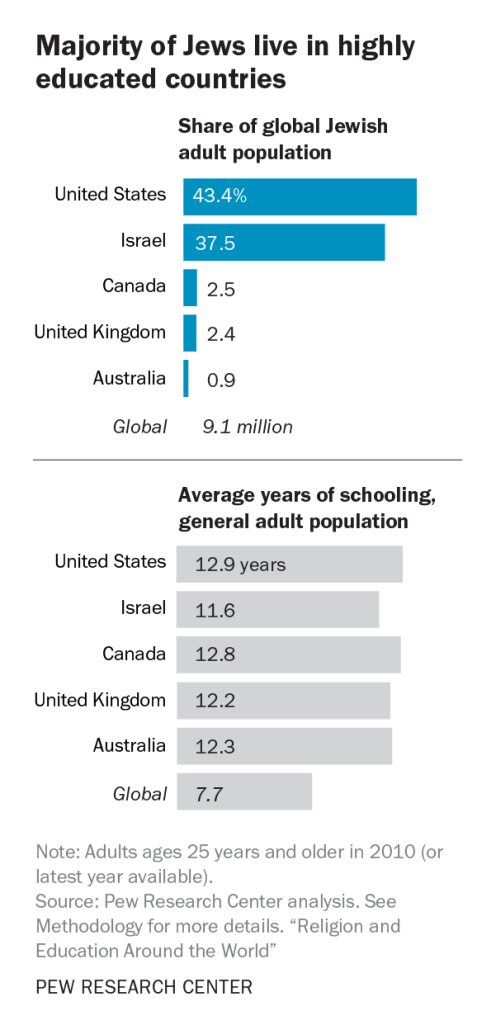
These wide disparities in educational attainment are partly a function of geography. For instance, a key reason Jews have such high levels of attainment is that the overwhelming majority live in the United States and Israel – two economically developed countries with high overall levels of education. Majority of Jews live in highly educated countries Share of global Jewish adult population Avg. years of schooling, general adult population United States 43.4% 12.9 years Israel 37.5 11.6 Canada 12.8 2.5 United Kingdom 12.2 2.4 Australia 12.3 0.9 Global 9.1 million 7.7 Note: Adults ages 25 years and older in 2010 (or latest year available). PEW RESEARCH CENTER Majority of Jews live in highly educated countries Share of global Jewish adult population United States 43.4% Israel 37.5 Canada 2.5 United Kingdom 2.4 Australia 0.9 Global 9.1 million Avg. years of schooling, general adult population United States 12.9 years Israel 11.6 Canada 12.8 United Kingdom 12.2 Australia 12.3 Global 7.7 Note: Adults ages 25 years and older in 2010 (or latest year available). PEW RESEARCH CENTER
Source: Pew Research Center analysis. See Methodology for more details. “Religion and Education Around the World”

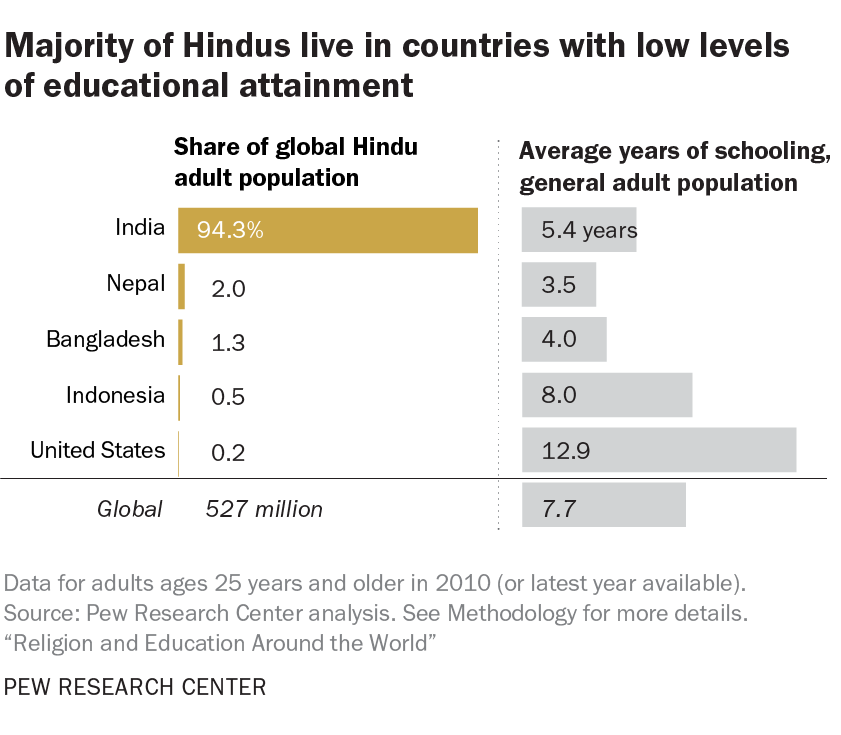
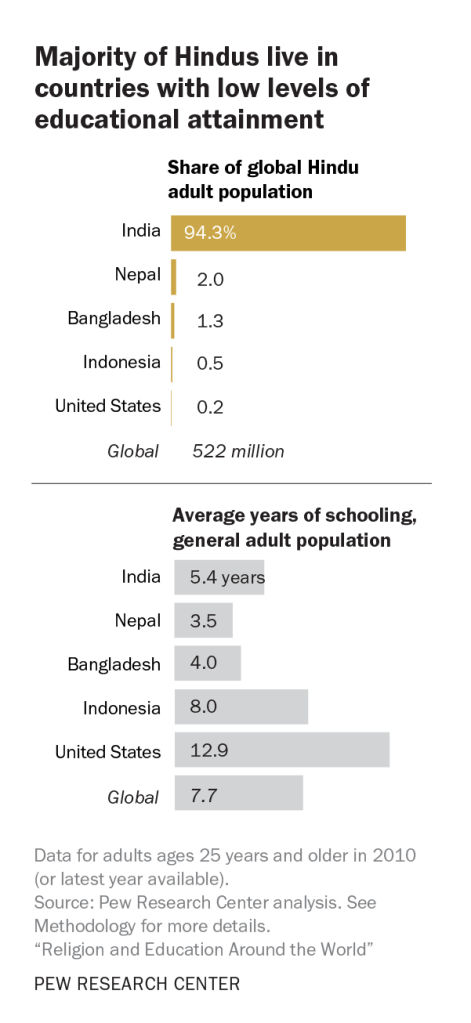
Likewise, low levels of educational attainment among Hindus partly stems from their concentration in the three developing countries of India, Nepal and Bangladesh, which are home to 98% of the world’s 527 million Hindu adults.

Majority of Hindus live in countries with low levels of educational attainment
Share of global Hindu adult population
Avg. years of schooling, general adult population
India
94.3%
5.4 years
Nepal
3.5
2.0
Bangladesh
4.0
1.3
Indonesia
8.0
0.5
United States
12.9
0.2
Global
527 million
7.7
Data for adults ages 25 years and older in 2010 (or latest year available).
Source: Pew Research Center analysis. See Methodology for more details.
“Religion and Education Around the World”
PEW RESEARCH CENTER

Majority of Hindus live in countries with low levels of educational attainment
Share of global Hindu adult population
India
94.3%
Nepal
2.0
Bangladesh
1.3
Indonesia
0.5
United States
0.2
Global
522 million
Average years of schooling,
general adult population
India
5.4 years
Nepal
3.5
4.0
Bangladesh
8.0
Indonesia
12.9
United States
7.7
Global
Data for adults ages 25 years and older in 2010 (or latest year available).
Source: Pew Research Center analysis. See Methodology for more details.
“Religion and Education Around the World”
PEW RESEARCH CENTER

Large education gaps in sub-Saharan Africa
But the new study also finds important, and often large, differences in educational attainment between religious groups living in the same region – and even the same country.
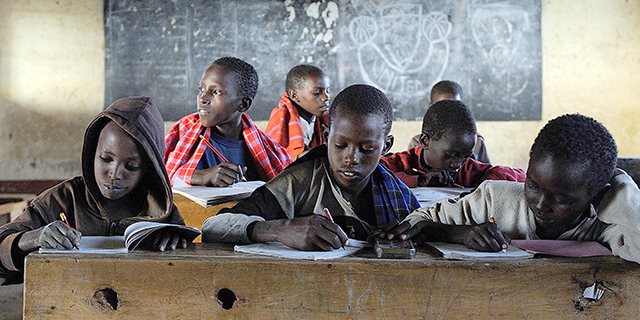
One of the most striking findings is the large and widespread gap in educational attainment between Muslims and Christians in sub-Saharan Africa. Muslims are more than twice as likely as Christians in the region to have no formal schooling – 65% of Muslims and 30% of Christians have no formal education, a 35-point gap. For perspective, the difference between Muslims and Christians in the share with no formal schooling is 3 points in Europe (5% and 2%, respectively) and 25 points in the Asia-Pacific region (32% and 7%).
These large differences between Muslims and Christians are found throughout the region, particularly in countries in western Africa, such as Nigeria, Chad and Cameroon. In 18 of the 27 sub-Saharan African countries with substantial Muslim and Christian populations, Muslims are more likely – by at least 10 percentage points – than their Christian compatriots to lack formal schooling. Muslim Christian Kenya 11% 59% 47pt. diff. Chad 50 89 40 Cameroon 24 62 38 25 61 Ghana 36 30 65 Regional avg. 35 MALI Nigeria 26 61 35 CHAD SENEGAL 39 73 Ivory Coast BURKINA FASO 34 BENIN 8 40 32 Rep. Congo NIGERIA IVORY COAST TOGO ETHIOPIA 8 40 Gabon 32 SIERRA LEONE CAMEROON 40 68 Senegal 28 LIBERIA GHANA UGANDA 50 77 Sierra Leone 27 CONGO KENYA GABON RWANDA DEM. REP. OF THE CONGO Benin 48 75 27 BURUNDI 24 49 Togo 25 TANZANIA Malawi 28 49 21 In 18 countries, Muslims are more likely than Christians to have no formal schooling by 10 percentage points or more. 70 87 Burkina Faso 18 MALAWI Liberia 53 68 15 ZAMBIA 70 83 Ethiopia 13 MADAGASCAR Mali 67 79 12 MOZAMBIQUE 31 42 Mozambique 9 MAURITIUS Tanzania 22 26 In five countries, the gap is less than 10 points. 19 20 Zambia SOUTH AFRICA Data not available for both Christians and Muslims Mauritius 5 5 2 2 Uganda 9 16 D.R. Congo 7 Note: Adults ages 25 years and older as of 2010 (or latest year available). Muslim-Christian differences are calculated based on unrounded numbers. Nine additional countries in sub-Saharan Africa are not shown because of missing education data for either Christians or Muslims. PEW RESEARCH CENTER 5 19 South Africa 14 In four countries, Christians are more likely than Muslims to have no formal schooling by 10 points or more. Rwanda 29 43 14 38 58 Madagascar 20 Burundi 32 55 23 Christian Muslim Kenya 11% 59% 47pt. diff. Chad 50 89 40 Cameroon 24 62 38 Ghana 25 61 36 Regional avg. 30 65 35 Nigeria 26 61 35 MALI Ivory Coast 39 73 34 CHAD SENEGAL 8 40 32 Rep. Congo BURKINA FASO BENIN NIGERIA IVORY COAST TOGO ETHIOPIA Gabon 8 40 32 SIERRA LEONE CAMEROON Senegal 40 68 28 LIBERIA GHANA UGANDA CONGO KENYA GABON RWANDA DEM. REP. OF THE CONGO Sierra Leone 50 77 27 BURUNDI TANZANIA 48 75 Benin 27 In 18 countries, Muslims are more likely than Christians to have no formal schooling by 10 percentage points or more. Togo 24 49 25 MALAWI ZAMBIA 28 49 Malawi 21 MADAGASCAR MOZAMBIQUE Burkina Faso 70 87 18 MAURITIUS 53 68 Liberia 15 Data not available for both Christians and Muslims SOUTH AFRICA Ethiopia 70 83 13 67 79 Mali 12 Mozambique 31 42 Note: Adults ages 25 years and older as of 2010 (or latest year available). Muslim-Christian differences are calculated based on unrounded numbers. Nine additional countries in sub-Saharan Africa are not shown because of missing education data for either Christians or Muslims. PEW RESEARCH CENTER 22 26 Tanzania In five countries, the gap is less than 10 points. Zambia 19 20 5 5 Mauritius Uganda 2 2 9 16 D.R. Congo 7 South Africa 5 19 In four countries, Christians are more likely than Muslims to have no formal schooling by 10 points or more. 14 29 43 Rwanda 14 Madagascar 38 58 20 32 55 Burundi 23 MALI CHAD SENEGAL BURKINA FASO BENIN IVORY COAST NIGERIA ETHIOPIA TOGO SIERRA LEONE CAMEROON LIBERIA GHANA UGANDA CONGO KENYA GABON RWANDA DEM. REP. OF THE CONGO BURUNDI TANZANIA Data not available for both Christians and Muslims MALAWI ZAMBIA MADAGASCAR MOZAMBIQUE MAURITIUS SOUTH AFRICA Christian Muslim Kenya 11% 47pt. diff. 59% Chad 50 40 89 Cameroon 24 38 62 36 Ghana 25 61 30 65 35 Regional avg. 35 Nigeria 26 61 Ivory Coast 39 34 73 32 Rep. Congo 8 40 32 Gabon 8 40 28 Senegal 40 68 Sierra Leone 50 27 77 27 Benin 48 75 Togo 24 25 49 21 Malawi 28 49 Burkina Faso 70 18 87 15 Liberia 53 68 Ethiopia 70 13 83 12 Mali 67 79 Mozambique 31 42 Tanzania 22 26 Zambia 19 20 Mauritius 5 5 Uganda 2 2 7 D.R. Congo 9 16 South Africa 5 14 19 29 14 Rwanda 43 Madagascar 38 20 58 23 Burundi 32 55 Note: Adults ages 25 years and older as of 2010 (or latest year available). Muslim-Christian differences are calculated based on unrounded numbers. Nine additional countries in sub-Saharan Africa are not shown because of missing education data for either Christians or Muslims. PEW RESEARCH CENTER
Source: Pew Research Center analysis. See Methodology for details.
“Religion and Education Around the World”
Source: Pew Research Center analysis. See Methodology for more details.
“Religion and Education Around the World”
Source: Pew Research Center analysis. See Methodology for more details.
“Religion and Education Around the World”
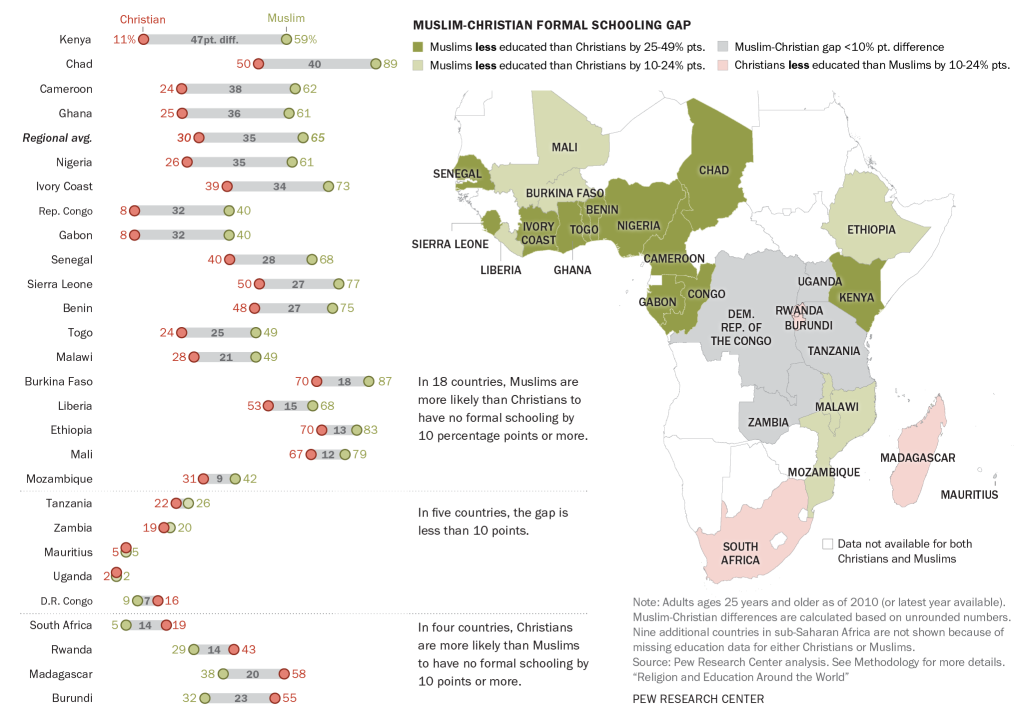
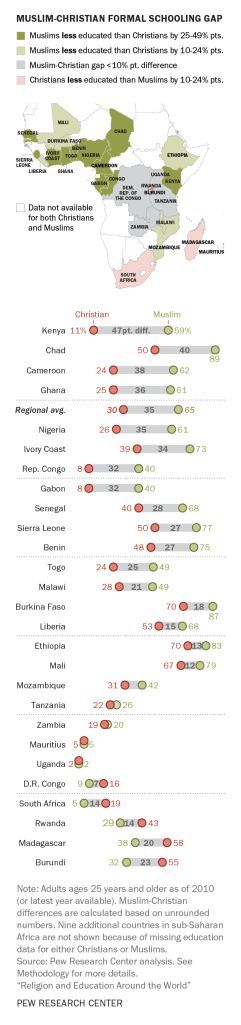
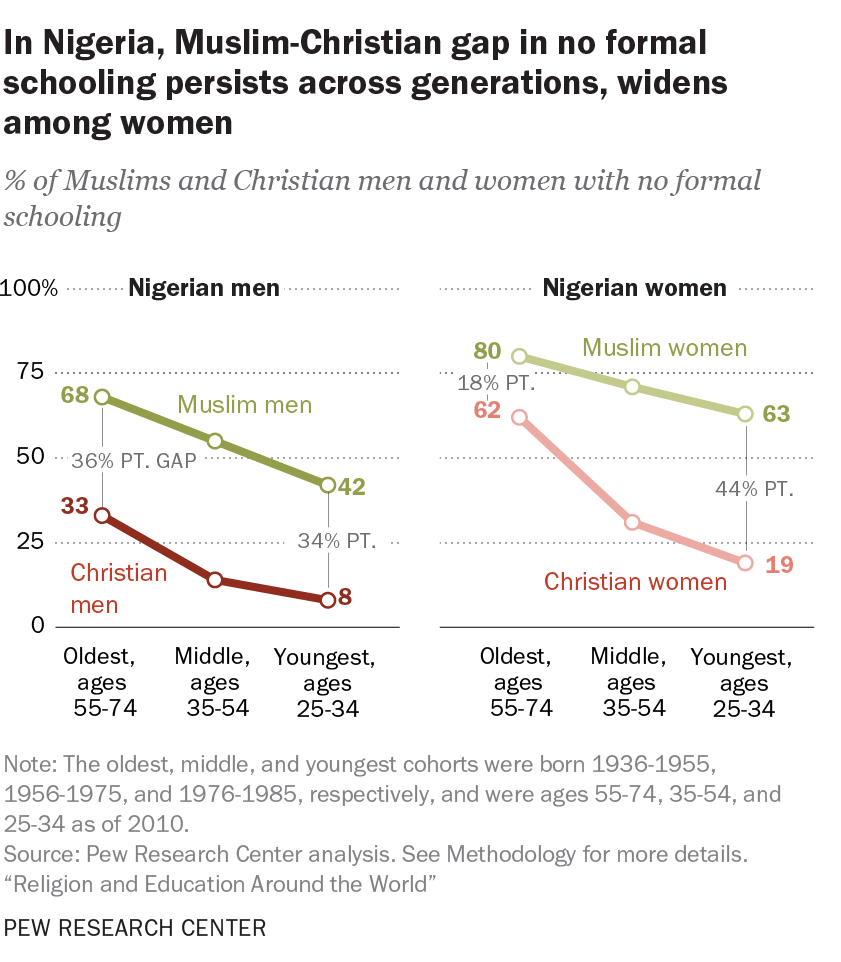
The Muslim-Christian education gap in sub-Saharan Africa is found among women and men, and has persisted across recent generations. One example of this is in Nigeria, Africa’s most populous country, where Christians and Muslims are present in roughly equal numbers. Among the youngest generation of Nigerian adults in the study – those ages 25 to 34 in 2010 – more than four-in-ten Muslim men (42%) and six-in-ten Muslim women (63%) have no formal schooling, compared with fewer than one-in-ten Christian men (8%) and two-in-ten Christian women (19%). In Nigeria, Muslim-Christian gap in no formal schooling persists across generations, widens among women % of Muslims and Christian men and women with no formal schooling Nigerian men Nigerian women 100% Muslim women 80 75 18% PT. 68 Muslim men 62 63 50 36% PT. GAP 42 44% PT. 33 25 34% PT. 19 Christian men Christian women 8 0 Oldest, ages 55-74 Middle, ages 35-54 Oldest, ages 55-74 Middle, ages 35-54 Youngest, ages 25-34 Youngest, ages 25-34 Note: The oldest, middle, and youngest cohorts were born 1936-1955, 1956-1975, and 1976-1985, respectively, and were ages 55-74, 35-54, and 25-34 as of 2010. PEW RESEARCH CENTER In Nigeria, Muslim-Christian gap in no formal schooling persists across generations, widens among women % of Muslims and Christian men and women with no formal schooling Nigerian men 100% 75 68 Muslim men 50 36% PT. GAP 42 33 25 34% PT. Christian men 8 0 Oldest, ages 55-74 Middle, ages 35-54 Youngest, ages 25-34 Nigerian women 100% Muslim women 80 75 18% PT. 62 63 50 44% PT. 25 19 Christian women 0 Oldest, ages 55-74 Middle, ages 35-54 Youngest, ages 25-34 Note: The oldest, middle, and youngest cohorts were born 1936-1955, 1956-1975, and 1976-1985, respectively, and were ages 55-74, 35-54, and 25-34 as of 2010. PEW RESEARCH CENTER
Source: Pew Research Center analysis. See Methodology for more details.
Religion and Education Around the World”
Source: Pew Research Center analysis. See Methodology for more details.
“Religion and Education Around the World”

In U.S., religious minorities more likely to have college degrees than Christian majority % with higher education, by religion Hindus 96% Jews 75 Muslims 54 Buddhists 53 Unaffiliated 44 39% U.S. average Christians 36 Note: Adults ages 25 years and older as of 2010 (or latest year available). PEW RESEARCH CENTERReligious minorities often have high attainment
Source: Pew Research Center analysis. See Methodology for more details.
“Religion and Education Around the World”
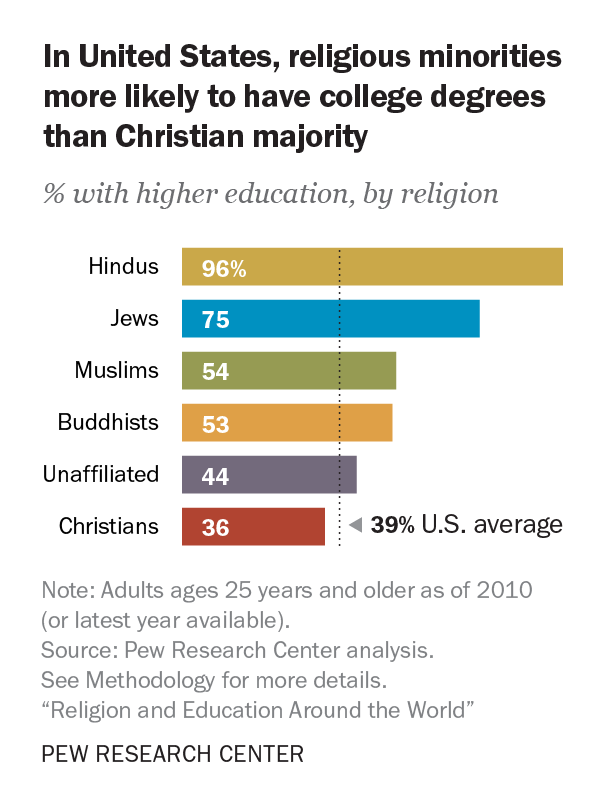
The report also finds that religious minorities often have more education, on average, than a country’s majority religious group, particularly when the minority group is largely foreign-born and comes from a distant country. In these cases, immigrants often were explicitly selected under immigration policies that favor highly-skilled applicants. In addition, it is often the well-educated who manage to overcome the financial and logistical challenges faced by those who wish to leave their homeland for a new, far-off country.
For instance, in the U.S., where Christians make up the majority of the adult population, Hindus and Muslims are much more likely than Christians to have post-secondary degrees. And unlike Christians, large majorities of Hindus and Muslims were born outside the United States (87% of Hindus and 64% of Muslims compared with 14% of Christians, according to a 2014 Pew Research Center survey).
Gains across generations
The report also shows that the global gaps between the highest- and lowest-attaining groups have been narrowing over time due to large gains by Hindus and Muslims in recent generations. The youngest Hindu adults in the study (those born between 1976 and 1985) have spent an average of 7.1 years in school, almost double the amount of schooling received by the oldest Hindus in the study (those born between 1936 and 1955). The youngest Muslims, Buddhists and religiously unaffiliated adults have made similar gains, receiving approximately three more years of schooling, on average, than older adults in the same groups. Over the same time frame, by contrast, Christians and Jews recorded smaller gains on their already relatively high levels of attainment. Muslims and Hindus have made the largest gains in educational attainment over decades Average years of formal schooling, by religious group across three generations 13.8 Jewish 13.4 10.3 Unaffiliated 9.9 Christians 9.7 Buddhists 8.9 8.6 Global average 7.4 7.1 Hindus 7.2 6.6 6.7 Muslims 3.6 3.5 0 Youngest, ages 25-34 Oldest, ages 55-74 Middle, ages 35-54 Note: The oldest, middle, and youngest cohorts were born 1936-1955, 1956-1975, and 1976-1985, respectively, and were ages 55-74, 35-54, and 25-34 as of 2010. PEW RESEARCH CENTER
Source: Pew Research Center analysis. See Methodology for more details.
“Religion and Education Around the World”
Women make big gains
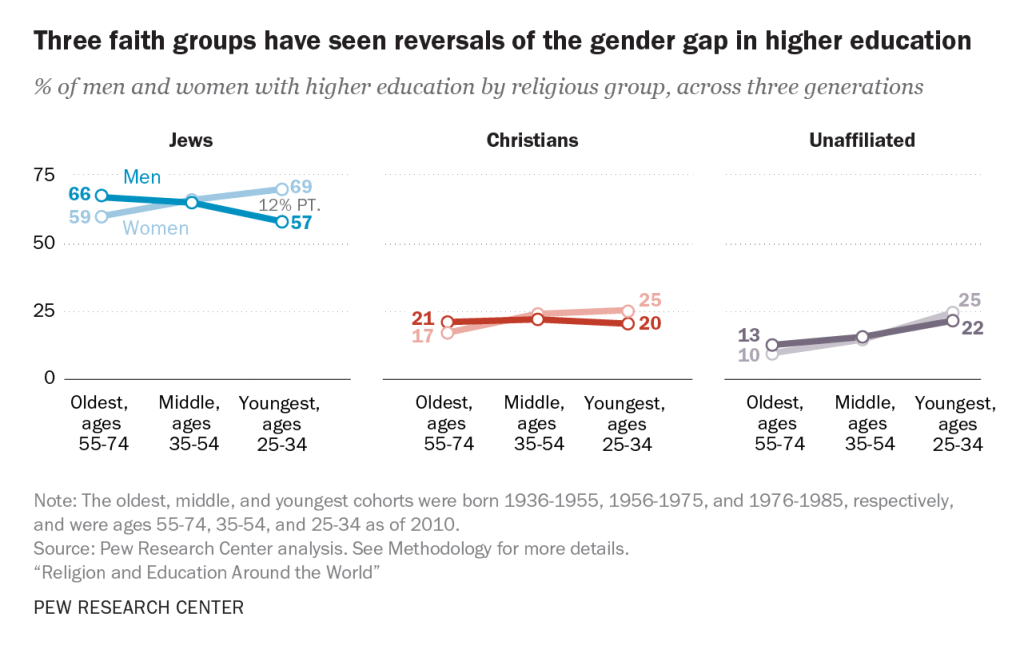
In addition, women have gained more than men in every major religious group, helping to close longstanding gender gaps in educational attainment. In fact, Christian, Jewish and religiously unaffiliated women in the youngest generation (ages 25 to 34 in 2010) are more likely than their male counterparts to have college degrees.

Three faith groups have seen reversals of the gender gap in higher education
% of men and women with higher education by religious group, across three generations
Jews
Christians
Unaffiliated
75
Men
69
66
12% PT.
59
57
Women
50
25
25
25
21
20
22
13
17
10
0
Oldest,
ages
55-74
Middle,
ages
35-54
Oldest,
ages
55-74
Middle,
ages
35-54
Oldest,
ages
55-74
Middle,
ages
35-54
Youngest,
ages
25-34
Youngest,
ages
25-34
Youngest,
ages
25-34
Note: The oldest, middle, and youngest cohorts were born 1936-1955, 1956-1975, and 1976-1985, respectively, and were ages 55-74, 35-54, and 25-34 as of 2010.
Source: Pew Research Center analysis. See Methodology for more details.
“Religion and Education Around the World”
PEW RESEARCH CENTER

Three faith groups have seen reversals of the gender gap in higher education
% of men and women with higher education by religious group, across three generations
Jews
75%
Men
69
66
12% PT.
59
57
Women
50
25
0
Oldest,
ages
55-74
Middle,
ages
35-54
Youngest,
ages
25-34
Christians
75%
50
25
25
21
20
17
0
Oldest,
ages
55-74
Middle,
ages
35-54
Youngest,
ages
25-34
Unaffiliated
75%
50
25
25
22
13
10
0
Oldest,
ages
55-74
Middle,
ages
35-54
Youngest,
ages
25-34
Note: The oldest, middle, and youngest cohorts were born 1936-1955, 1956-1975, and 1976-1985, respectively, and were ages 55-74, 35-54, and 25-34 as of 2010.
Source: Pew Research Center analysis. See Methodology for more details.
“Religion and Education Around the World”
PEW RESEARCH CENTER

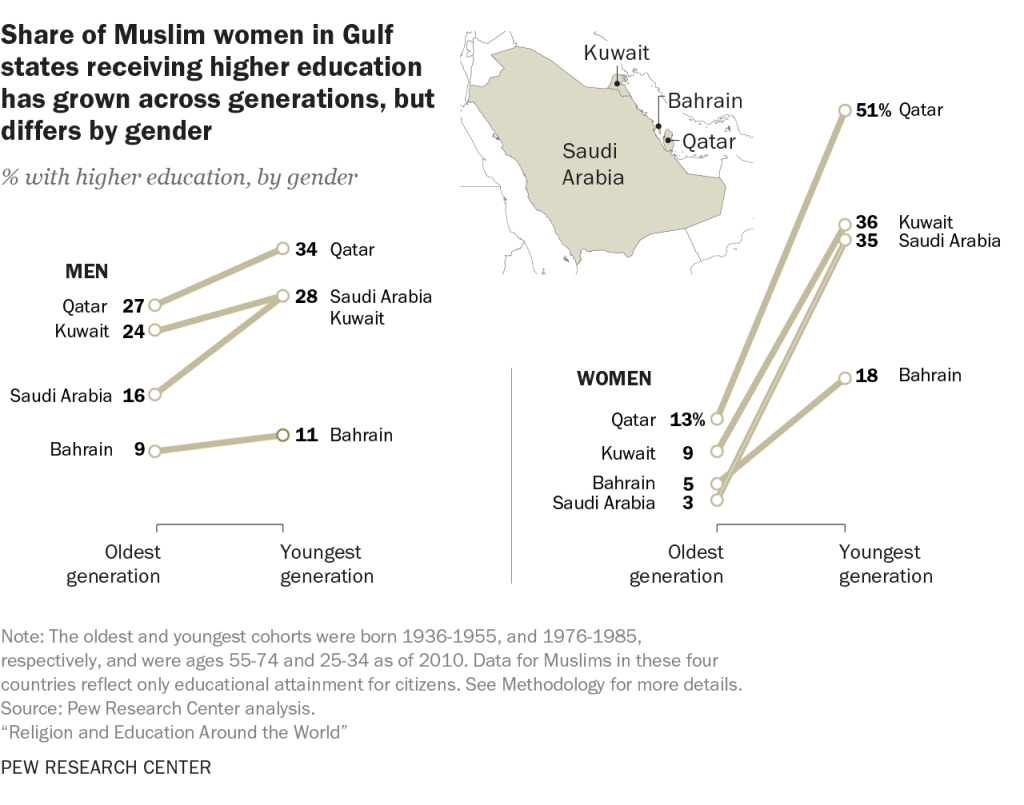
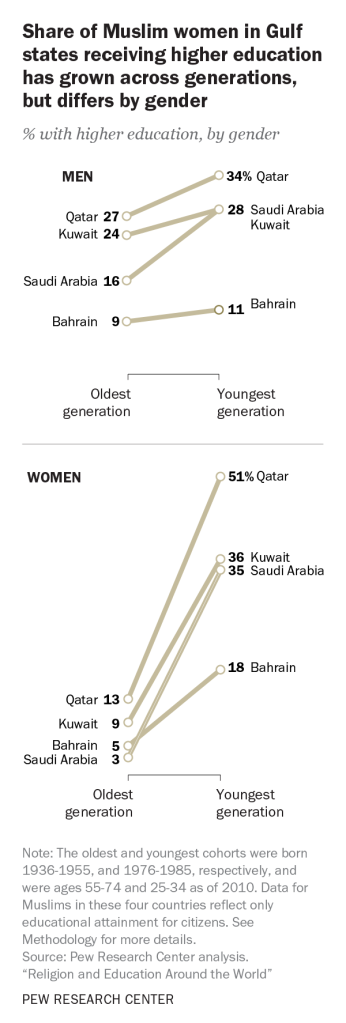
Some of the biggest gains in higher education have occurred among Muslim women in Gulf Cooperation Council states. In Saudi Arabia, for instance, the share of Muslim women with college degrees has increased tenfold, from 3% in the oldest generation to 35% in the youngest. By comparison, the share of Saudi men with post-secondary degrees has risen by 12 percentage points, from 16% among the oldest generation to 28% among the youngest. Share of Muslim women in % with higher education, by gender Kuwait Bahrain Qatar 51% Qatar Saudi Arabia 36 Kuwait 35 Saudi Arabia 34 Qatar MEN Saudi Arabia 28 Qatar 27 Kuwait Kuwait 24 Bahrain 18 WOMEN Saudi Arabia 16 Qatar 13% Bahrain 11 Bahrain 9 Kuwait 9 Bahrain 5 Saudi Arabia 3 Oldest generation Youngest generation Oldest generation Youngest generation Note: The oldest and youngest cohorts were born 1936-1955, and 1976-1985, respectively, and were ages 55-74 and 25-34 as of 2010. Data for Muslims in these four countries reflect only educational attainment for citizens. See Methodology for more details. PEW RESEARCH CENTER Share of Muslim women in Gulf states receiving higher education has grown across generations, differs by gender % with higher education, by gender MEN 34% Qatar Saudi Arabia 28 Qatar 27 Kuwait Kuwait 24 Saudi Arabia 16 Bahrain 11 Bahrain 9 Oldest generation Youngest generation Qatar WOMEN 51% 36 Kuwait 35 Saudi Arabia Bahrain 18 Qatar 13 Kuwait 9 Bahrain 5 Saudi Arabia 3 Oldest generation Youngest generation Note: The oldest and youngest cohorts were born 1936-1955, and 1976-1985, respectively, and were ages 55-74 and 25-34 as of 2010. Data for Muslims in these four countries reflect only educational attainment for citizens. See Methodology for more details. PEW RESEARCH CENTER
Gulf states receiving higher education has grown across generations, differs by gender
Source: Pew Research Center analysis.
“Religion and Education Around the World”
Source: Pew Research Center analysis.
“Religion and Education Around the World”
Read the full report, “Religion and Education Around the World.”