By Aleksandra Sandstrom
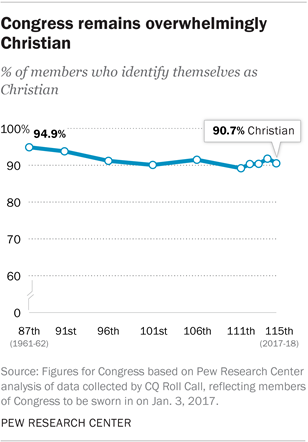
The share of U.S. adults who describe themselves as Christians has been declining for decades, but the U.S. Congress is about as Christian today as it was in the early 1960s, according to a new analysis by Pew Research Center.1 Indeed, among members of the new, 115th Congress, 91% describe themselves as Christians. This is nearly the same percentage as in the 87th Congress (1961 to 1962, the earliest years for which comparable data are available), when 95% of members were Christian.
Among the 293 Republicans elected to serve in the new, 115th Congress, all but two identify as Christians; there are two Jewish Republicans – Lee Zeldin of New York and David Kustoff of Tennessee – who both serve in the House. Democrats in Congress also are overwhelmingly Christian (80%), but there is more religious diversity on this side of the aisle. The 242 Democrats in Congress include 28 Jews, three Buddhists, three Hindus, two Muslims and one Unitarian Universalist – as well as the only member of Congress to describe herself as religiously unaffiliated, Rep. Kyrsten Sinema, D-Ariz. In addition, all 10 members of Congress who decline to state their religious affiliation are Democrats.2
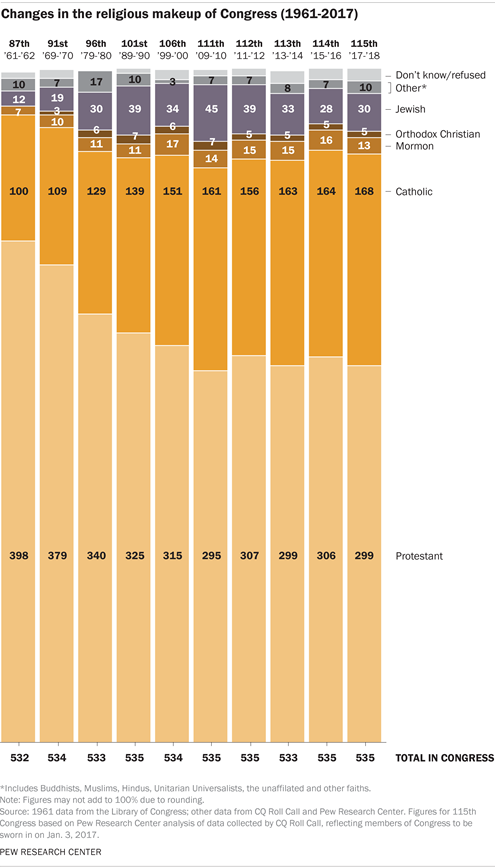
Like the nation as a whole, Congress has become much less Protestant over time. The total percentage of Protestants in Congress has dropped from 75% in 1961 (at the beginning of the 87th Congress) to 56% today. During this period, the share of Catholics in Congress has gone from 19% to 31%.
Fully two-thirds of Republicans in the new Congress (67%) are Protestant, while 27% are Catholic. The breakdown between Protestants and Catholics is more even among the Democrats; 42% of the Democratic members are Protestants and 37% are Catholics.
These are some of the key findings from an analysis by Pew Research Center of congressional data compiled by CQ Roll Call. CQ Roll Call gathered information on the religious affiliations of members of Congress through questionnaires and follow-up phone calls to members’ and candidates’ offices. The new analysis compares the religious affiliations of members of Congress with Pew Research Center survey data on the U.S. public.3
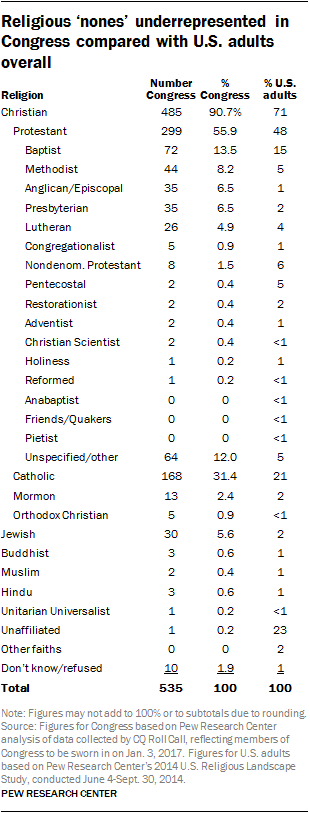
The analysis finds that some religious groups, including Protestants, Catholics and Jews, have greater representation in Congress than in the general population. Jews, for example, make up 2% of the U.S. adult population but account for 6% of Congress. Other groups – including Buddhists, Mormons, Muslims and Orthodox Christians – are represented in Congress in roughly equal proportion to their share of the U.S. public
The group that is most notably underrepresented is the religiously unaffiliated. This group – also known as religious “nones” – now accounts for 23% of the general public but just 0.2% of Congress. As noted above, Kyrsten Sinema of Arizona is the only member who describes herself as religiously unaffiliated.
New Congress looks a lot like the 114th
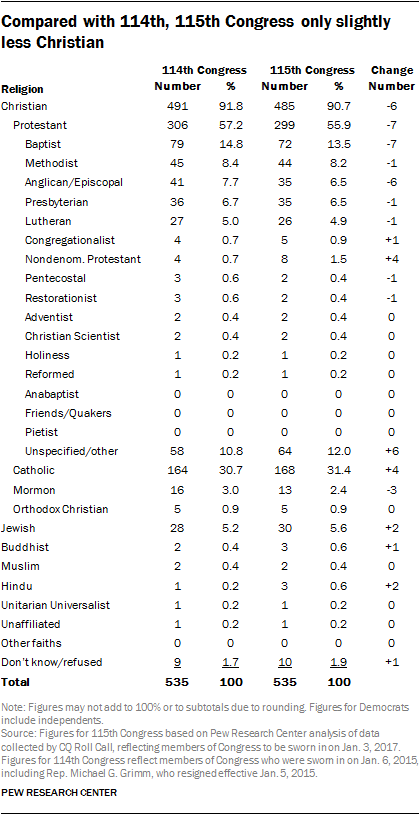
The 115th Congress has seven fewer Protestants than the 114th (299, compared with 306 at the beginning of the 114th Congress).
Among Protestant denominational families, Baptists had the biggest losses (down seven seats), followed by Anglicans and Episcopalians (down six seats). Nondenominational Protestants gained a total of four seats. Protestants in the “unspecified/other” category also gained six seats. The number of seats held by members of other Protestant groups remained roughly the same.4
There are four more Catholics in the new Congress (168) than in the previous one. Mormons lost three seats, bringing the total number of Mormons to 13. The number of Orthodox Christians (five) stayed the same. Overall, there are six fewer Christians in the 115th Congress than there were in the 114th (485 vs. 491).
Among non-Christian religious groups, Jews and Hindus had the biggest gains (an increase of two seats each). Jews, who make up 2% of the U.S. adult population, hold 30 seats in the new Congress (6%), up from 28 seats in the 114th (5%). However, Jews occupy far fewer seats than they did in the 111th Congress (2009-10), when there were 45 Jewish members of the House and Senate.
The number of Hindus in Congress rose from one to three, as Rep. Ro Khanna, D-Calif., and Rep. Raja Krishnamoorthi, D-Ill., joined Rep. Tulsi Gabbard, D-Hawaii, who was first elected to serve in the 113th Congress (2013 to 2014) and has been re-elected twice.
The election of Rep. Colleen Hanabusa, D-Hawaii, brought the number of Buddhists in Congress from two to three. The other two Buddhists in the 115th Congress are Sen. Mazie K. Hirono, D-Hawaii, and Rep. Hank Johnson, D-Ga.
The number of Muslims in Congress (two) stayed the same, meaning there are now more Buddhists and Hindus serving in Congress than there are Muslims. One of the two Muslims in Congress – Rep. Keith Ellison, D-Minn. – is considering running for chair of the Democratic National Committee and has said he would resign his seat if he is selected. (Rep. Andre Carson, D-Ind., is the other Muslim serving in the 115th Congress.)
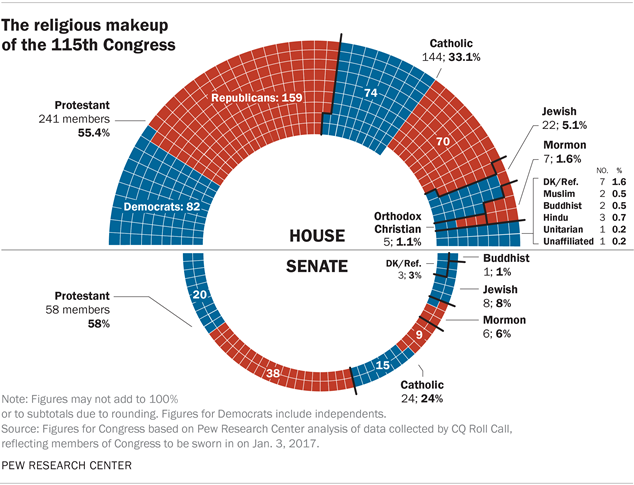
Differences by chamber
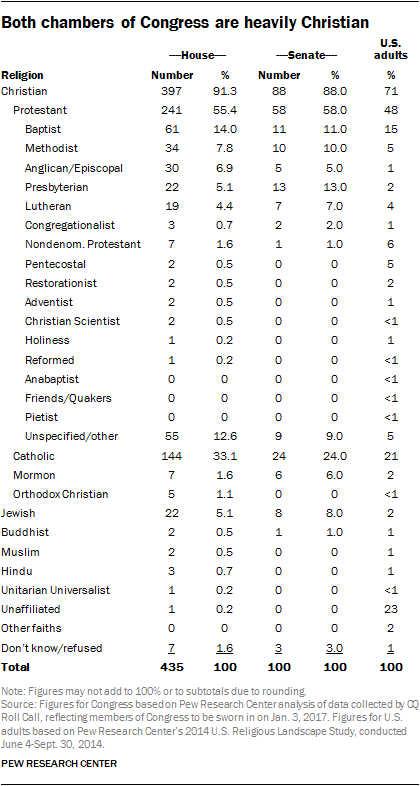
Both the House and Senate have Protestant majorities (58% in the Senate and 55% in the House). But there are differences among Protestant denominational families. Baptists, for instance, are more numerous in the House (in percentage terms) than in the Senate, while Presbyterians and Lutherans account for greater shares of the Senate than the House.
Fully a third of House members are Catholic, compared with about a quarter (24%) of the Senate. Mormons make up 6% of the Senate and roughly 2% of the House. All five Orthodox Christians in Congress are members of the House.
Jews make up a higher proportion of the Senate than the House (8% vs. 5%). Additionally, the House includes several non-Christian groups that each make up less than 1% of the body: There are two Buddhists, two Muslims, three Hindus, one Unitarian Universalist and one religiously unaffiliated member. Of these faiths, only one is present in the Senate – Sen. Mazie K. Hirono, D-Hawaii, is a Buddhist.
Differences by party
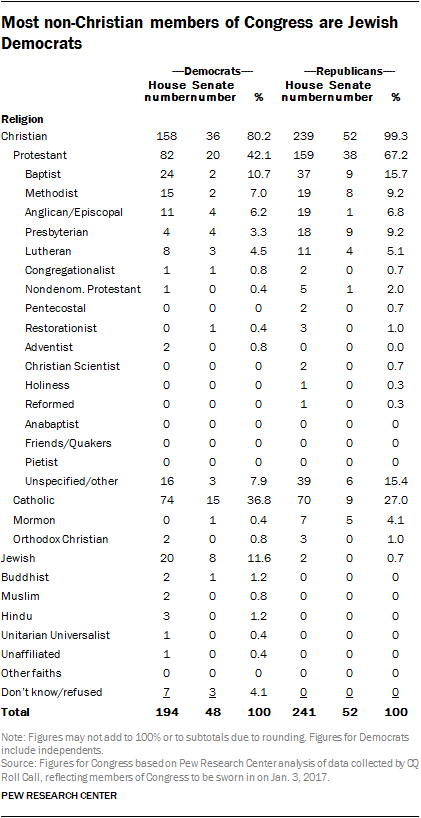
As with Republicans in the general public, Republican members of Congress are overwhelmingly Christian (99%). Among U.S. adults who identify with or lean toward the Republican Party, 82% are Christian.
Most congressional Republicans (67%) are Protestant. In fact, 46% fall into one of five Protestant denominational families: Baptist, Methodist, Anglican or Episcopalian, Presbyterian and Lutheran.
There are fewer Christian Democrats than Republicans, both among U.S. adults overall (63% of those who identify with or lean toward the Democratic Party are Christian) and in Congress, where eight-in-ten Democrats identify as Christians.5
Democrats are less Protestant than Republicans by 25 percentage points. This is due, in part, to the fact that the share of Catholics among Democrats in Congress exceeds the share of Catholics among Republicans in Congress by nearly 10 points.
Of the 30 Jewish members of Congress, 28 are Democrats. In addition, all 10 members who decline to give their religious affiliation are Democrats.
First-time members
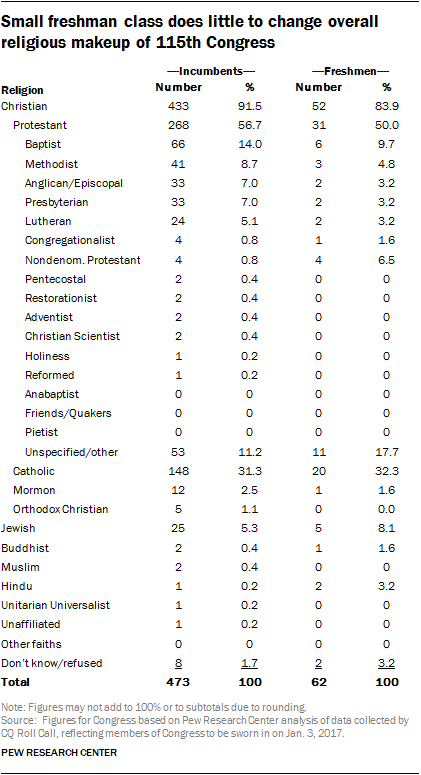
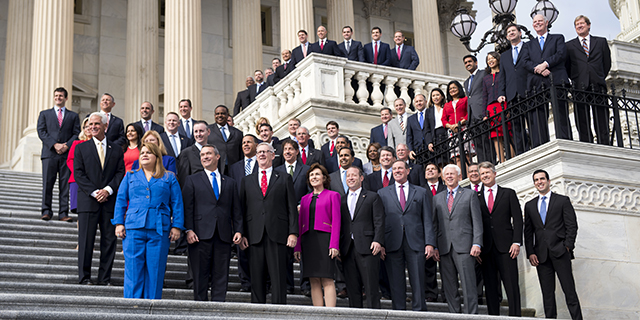
The new, 115th Congress has the smallest freshman class of any Congress in the last 10 years – 62 new members will be joining 473 incumbents.
Of the new members, half are Protestant and roughly a third are Catholic.
Additionally, 13% of freshmen are members of non-Christian faiths, nearly double the share of incumbents who are not members of a Christian faith.
Upwards of half of non-Christian freshmen are Jewish (8%). This is by far the largest share of Jews in any freshman class for which data are available. In the 114th Congress, 1% of freshmen were Jews; in the 113th, 4% were Jews; in the 112th, 2% were Jews.
As noted above, two of the freshman members are Hindus: Ro Khanna, D-Calif., and Raja Krishnamoorthi, D-Ill.
Looking back
When compared with the earliest Congress for which data are available (the 87th Congress), the overall religious affiliation of the 115th Congress has changed relatively little. When the 87th Congress convened in 1961, 95% of members were Christian; in the 115th, 91% of members are Christian.
Within Christianity, however, Congress has seen a major shift as the share of Protestants has declined, a trend mirrored in the overall decline of the U.S. Protestant population. Protestants made up fully three-quarters of the 87th Congress, compared with 56% of the current Congress. Meanwhile, Catholics, who made up 19% of the 87th Congress, now make up 31% of the body.