Majority Continues to Favor Gays Serving Openly in Military
Overview
Polls this year have found that more Americans favor allowing gays and lesbians to marry legally than did so just last year. In two polls conducted over the past few months, based on interviews with more than 6,000 adults, 42% favor same-sex marriage while 48% are opposed. In polls conducted in 2009, 37% favored allowing gays and lesbians to marry legally and 54% were opposed. For the first time in 15 years of Pew Research Center polling, fewer than half oppose same-sex marriage.
The shift in opinion on same-sex marriage has been broad-based, occurring across many demographic, political and religious groups. Notably, pluralities of white mainline Protestants and white Catholics now favor allowing gays and lesbians to marry legally – the first time this has occurred in Pew Research Center surveys. Political independents are divided in their views of same-sex-marriage; in 2009, they opposed it by a wide margin.
The surveys conducted by the Pew Research Center for the People & the Press and Pew Forum on Religion & Public Life have found that same-sex marriage ranks at the bottom of the list of issues in this year’s congressional elections. Not surprisingly, far more voters are saying the economy and jobs will be very important to their vote this year.
The public continues to be far more supportive of gays and lesbians serving openly in the military than of allowing legal same-sex marriages. This year, 60% say they favor allowing gays and lesbians to serve openly in the military, while 30% oppose this. Support for gays serving openly in the military has remained fairly stable over the last five years. In 1994, shortly after the Clinton administration implemented the “Don’t Ask, Don’t Tell” policy, opinion was more evenly divided (52% favor vs. 45% oppose).
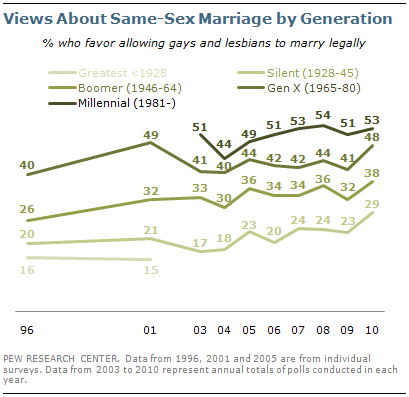
Persistent Generational Divide
There are substantial age and generational differences in opinions about same-sex marriage. Millennials, born after 1980, favor allowing gays and lesbians to marry legally by a 53% to 39% margin. Support for gay marriage among Millennials has changed little in recent years, but is up from 2004 when opinion was more divided.
Among Gen Xers (born 1965 to 1980), 48% now favor allowing gays and lesbians to marry legally while 43% are opposed. Support is up from 2009 when 41% favored this and 50% were opposed, but is on par with levels in 2001.
There is less support for same-sex marriage among Baby Boomers – those born 1946 to 1964 – than among younger age groups. Currently, 38% favor allowing gays and lesbians to marry legally while 52% are opposed. Still, support among Baby Boomers has increased over the past year (from 32%).
The Silent Generation (born 1928 to 1945) continues to oppose same-sex marriage; just 29% favor allowing gays and lesbians to marry legally while 59% are opposed. Even among the Silent Generation, however, there is somewhat more support than in 2009 (23% favor) and substantially greater support than in 2003, when just 17% backed gay marriage.
Partisan and Ideological Differences
There also are substantial partisan differences on the issue of same-sex marriage. A majority of Democrats (53%) favor allowing gays and lesbians to marry legally while 38% are opposed. By contrast, only 24% of Republicans support same-sex marriage and 69% are opposed.
Independents and other non-partisans are now divided in their view: 44% favor allowing gays and lesbians to marry legally while 43% are opposed. In 2009, more independents opposed same-sex marriage than favored it (37% favor, 51% oppose). Throughout the past decade, opinion among independents has tracked more closely with Democrats than Republicans on this issue.
Among Democrats and Republicans there is a substantial ideological divide. Liberal Democrats favor allowing gays and lesbians to marry legally by more than a three-to-one margin (75% favor, 20% oppose). And conservative Republicans oppose same-sex marriage by an equally wide margin (16% favor, 77% oppose). But moderate Republicans and Democrats are more divided in their views. While 41% of moderate and liberal Republicans support same-sex marriage, 51% are opposed. Similarly, 41% of conservative and moderate Democrats favor allowing gays and lesbians to marry legally and 48% are opposed.
Race and Gender Gaps
Whites are now evenly divided over gay marriage; in polls conducted this year, 44% of non-Hispanic whites favor allowing gays and lesbians to marry legally and 46% are opposed. In three surveys between August 2008 and August 2009, 39% of non-Hispanic whites favored same-sex marriage compared with 52% who were opposed.
By contrast, blacks continue to oppose same-sex marriage by a wide margin. In 2010, just 30% of non-Hispanic blacks favor gay marriage while 59% are opposed. From 2008 to 2009, 28% of blacks favored same-sex marriage and 62% were opposed (surveys were combined to increase sample size). Notably, the gender, age and education differences among the general public are mirrored among whites and blacks; however, there is far less support among all subgroups of blacks.
Overall, women continue to be more supportive of same-sex marriage than are men. Opinion among women is evenly divided: 46% favor same-sex marriage and 45% are opposed. Roughly four-in-ten (38%) men support allowing gays and lesbians to marry legally while 51% are opposed.
A majority (52%) of college graduates favor allowing gays and lesbians to marry legally. Support is much lower among those without a college degree – 46% with some college education and 34% with a high school education or less support same-sex marriage. But among these two education groups, more now favor same-sex marriage than did so over the past two years.
Americans living in the Midwest are now evenly split over same-sex marriage; 44% favor and 44% oppose allowing gays and lesbians to marry legally. Opinion has shifted substantially since 2008 and 2009 when only 36% in the Midwest favored this and 54% were opposed. Support also is up in the South but a majority (55%) continues to oppose allowing same-sex marriage. As was the case over the past two years, more in the Northeast favor than oppose allowing gays and lesbians to marry legally (49% vs. 41%). Those living in the West are about evenly divided in their opinion (47% favor, 45% oppose).
For details on these comparisons and others, as well as data for 1996, see tables on pgs. 14-17.
White Catholics More Supportive
White mainline Protestants and white Catholics have become more supportive of gay marriage, though
virtually all of the change in opinion among both groups has come among those who attend services relatively infrequently.
About half (49%) of white mainline Protestants support same-sex marriage while 38% oppose this. This is a reversal of opinion from the past two years when 40% favored and 49% opposed allowing gays and lesbians to marry legally. Just 35% of white mainline Protestants who attend church at least once a week favor same-sex marriage, nearly the same percentage as in 2008-2009 (34%). Among those who attend services less often, support has increased by 11 points (from 42% to 53%).
There has been a similar shift among white Catholics – 49% now favor same-sex marriage while 41% are opposed. Opinion was more evenly divided over the past two years (44% fa
vor, 45% oppose). Here too, support has increased among those who attend services less than weekly, from 51% in 2008-2009 to 59% in 2010.
White evangelical Protestants overwhelmingly oppose gay marriage (20% favor vs. 74% oppose), and these opinions have changed little since 2008-2009. Similarly, black Protestants continue to oppose gay marriage by a wide margin (28% favor vs. 62% oppose).
By contrast, Jews and the unaffiliated have remained far more supportive of same-sex marriage. Their views also have changed little during this time. Three-quarters of Jews (76%) and 62% of the religiously unaffiliated say they favor allowing gays and lesbians to marry legally.
Same-Sex Marriage and the 2010 Vote
The economy and jobs overshadow other issues, including social issues such as abortion and gay marriage, in importance for voters. Fully 90% of registered voters say the economy will be very important to their vote while nearly as many (88%) rate jobs as very important.
By contrast, just 43% say abortion will be very important and just 32% say the same about same-sex marriage – the lowest percentage for 13 issues tested. Opponents of same-sex marriage (44% very important) are more likely than supporters (22%) to say that this issue will be very important to their vote.
White evangelical Protestant voters are far more likely than any other religious group to say that same-sex marriage is very important to their vote in this year’s midterm election – 46% say this compared with less than a third in all other religious groups. For more on the importance of various issues in the 2010 elections and the impact of religion on various issues, see Few Say Religion Shapes Immigration, Environment Views: Religion and the Issues.
Gays in the Military
By a two-to-one margin (60% favor, 30% oppose), Americans favor allowing gays and lesbians to serve openly in the military. While views on this issue have changed little in recent years, there was less support for gays serving openly in 1994 (52% favor vs. 45% oppose).
Across most demographic groups, majorities favor allowing gays and lesbians to serve openly in the military – and in most groups there is more support than in 1994. Nonetheless, as with views about same-sex marriage, there are differences of opinion across political and demographic groups. Democrats, women, whites, younger people and college graduates are more likely to support gays and lesbians serving openly in the military.
Opinion is more divided among key groups who also oppose same-sex marriage – 47% of Republicans favor allowing gays and lesbians to serve openly in the military while 43% are opposed. By comparison, 67% of Democrats and 63% of independents favor this.
While 43% of white evangelical Protestants support allowing gays and lesbians to serve openly in the military, 47% are opposed. Black Protestants are similarly divided (46% favor, 41% oppose). Support is greater among other religious groups – 68% of white mainline Protestants, 68% of Catholics and 66% of the religiously unaffiliated favor allowing gays and lesbians to serve openly in the military. And far fewer people who attend religious services weekly or more support gays serving openly in the military compared with those who attend less often.
For more, see the following reports from the Pew Research Center:
“Americans Spending More Time Following the News,” Sept. 12, 2010, Pew Research Center for the People & the Press. This report includes an analysis of where gay rights supporters and opponents regularly get news.