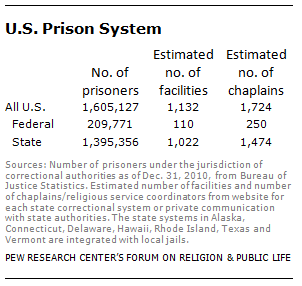
The U.S. prison system is composed of federal prisons and state prisons. State prisons hold the bulk of the total prison population. Nearly 1.4 million inmates, or 87% of the total U.S. prison population, are under the jurisdiction of state correctional authorities. About 200,000 prison inmates, or 13% of the total, are under the jurisdiction of federal authorities.27 These figures from the U.S. Bureau of Justice Statistics include persons held in state- and federally run prisons, penitentiaries, correctional facilities, halfway houses, boot camps, farms, training or treatment centers and hospitals. They also include persons held in privately operated facilities or local jails under contract to state or federal correctional authorities.

In addition, county and city jails hold many people who are awaiting trial or have been sentenced for misdemeanors to terms of one year or less. These people are not, technically, in the prison system, as defined by the U.S. Department of Justice, though they are considered part of the broader penal system. Counting all the men and women held in jails, the U.S. penal system has about 2.3 million adults under incarceration.28 That figure does not include those on probation or parole.
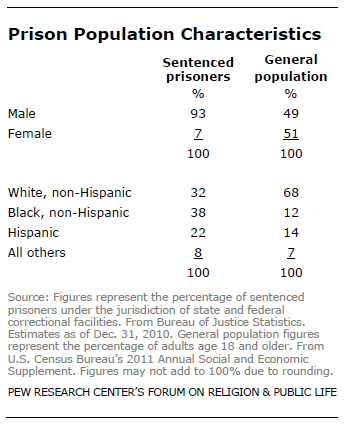
The U.S. prison population is quite different from the general public on a number of demographic characteristics. For example, 93% of sentenced prisoners in the U.S. system are men; only 7% are women. The general population in the U.S. is composed of roughly equal numbers of men and women.

In addition, incarceration rates are higher among racial and ethnic minorities than among whites. A majority of the U.S. prison population is made up of racial and ethnic minorities: 38% of U.S. prisoners are black and 22% are Hispanic. Just 32% are non-Hispanic whites, and 8% are of other racial backgrounds. Among the general population, 68% are non-Hispanic whites, 12% are non-Hispanic blacks, 14% are Hispanic, and 7% are of some other background.29
Most state prisons employ at least one full-time, paid chaplain or religious services coordinator to meet the needs of the adult prison population.30 The job of the chaplain typically involves serving all faith groups in that institution. Some states also contract with outside clergy or rely on volunteers to meet the needs of faith groups not represented by full-time chaplaincy staff.
Footnotes:
27 For more details on the U.S. prison system, see Paul Guerino, Paige M. Harrison and William J. Sabol, “Prisoners in 2010 (PDF),” U.S. Department of Justice, Bureau of Justice Statistics, 2011. (return to text)
28 This figure includes those who are in county or city jails awaiting trial or serving time for misdemeanor offenses. See “One in 100: Behind Bars in America 2008,” Pew Center on the States, Public Safety Performance Project, February 2008. For more details on local jails, see Todd D. Minton, “Jail Inmates at Midyear 2010 – Statistical Table (PDF),” U.S. Department of Justice, Bureau of Justice Statistics, 2011. (return to text)
29 General population figures represent the percentage of adults age 18 and older. See “Current Population Survey, 2011 Annual Social and Economic Supplement (PDF),” U.S. Census Bureau, 2011. (return to text)
30 One state, South Dakota, employs a “cultural activities coordinator” whose responsibilities include religious programs in prisons. (return to text)
Photo Credit: © Illustration Works/Corbis


