The survey suggests that intermarriage is common among Jews; 44% of all currently married Jewish respondents – and 58% of those who have married since 2005 – indicate they are married to a non-Jewish spouse. The survey also shows that in some important respects, U.S. Jews have a distinctive demographic profile: They are older than the U.S. population as a whole, have high levels of educational attainment as well as average household income, and are geographically concentrated in the Northeast.
Intermarriage
There are many different ways to calculate rates of religious intermarriage, which can result in confusion when making comparisons among studies. For example, one can focus either on the percentage of individuals who are intermarried or on the percentage of couples who are intermarried. One can ask whether a married couple had the same religion at the time of their wedding or whether they have the same religion at present. In theory, one can calculate rates based either on currently intact marriages or on all marriages, including divorces and annulments (though in practice, asking respondents to describe previous marriages may be burdensome, and the Pew Research Center survey did not attempt to do so). In addition, the same considerations that go into defining which respondents are Jewish come into play when deciding which spouses are Jewish. This analysis focuses on Jewish respondents in this survey (i.e., on the percentage of Jewish respondents who are married to non-Jews) and on current, intact marriages. It defines spouses as Jewish in the same way that respondents are categorized.
About half of Jewish respondents are currently married, including 54% of Jews by religion and 41% of Jews of no religion. The share of Jews who are married appears to have declined since 2000 (down from 60% in the 2000-2001 NJPS to 51% today), mirroring a decline in marriage rates among the population overall.
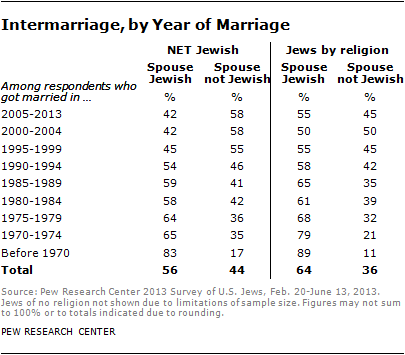
The new Pew Research survey finds that, overall, 56% of married Jews have a Jewish spouse, while 44% of Jewish respondents are married to a non-Jew. Among Jews by religion who are married, 64% have a Jewish spouse and 36% have a non-Jewish spouse. By comparison, Jews of no religion are much more likely to be in mixed marriages; just 21% of married Jews of no religion are married to a Jewish spouse, while 79% are married to a non-Jewish spouse.
Among respondents whose current, intact marriage took place in 2005 or later, 58% have a non-Jewish spouse. A similar number of those who got married between 2000 and 2004 are also in mixed marriages, as are 55% of those who got married in the late 1990s. Intermarriage rates are lower for those who have been married longer. For example, among respondents who got married in the 1980s, roughly four-in-ten have a non-Jewish spouse. And among those who were wed before 1970, just 17% have a non-Jewish spouse.
Among Jews by religion who got married in 2005 or more recently, 55% are married to a Jewish spouse and 45% are married to a non-Jew. (There are too few married Jews of no religion in the current sample to permit separate analysis of intermarriage rates by year of marriage for Jews of no religion alone.)
While these patterns strongly suggest that intermarriage has been rising, at least over the long term, it is important to bear in mind several points when assessing rates of Jewish intermarriage. First, some research indicates that “in-marriages” (marriages between people of the same religion) tend to be more durable than intermarriages; if this is the case, then the percentage of intermarriages in the 1970s and 1980s may have been higher than it appears from looking only at intact marriages today.
Second, racial and ethnic intermarriage as a whole has been increasing in the U.S. public; about 15% of all new marriages in the United States in 2010 were between spouses of a different race or ethnicity from one another, more than double the share in 1980 (6.7%).16
And, finally, the relatively small size of the U.S. Jewish population should be taken into account. If marital choices were purely random, the odds of one Jewish American marrying another Jewish American would be much smaller than the odds of one Protestant marrying another Protestant or one Catholic marrying another Catholic, since Protestants make up nearly half of the U.S. public and Catholics make up roughly a quarter of the overall population.17 For this reason, rates of intermarriage among Jews are perhaps most directly comparable to rates of intermarriage among other relatively small U.S. religious groups, such as Mormons and Muslims. Previous Pew Research surveys have found that 87% of Mormons and more than eight-in-ten Muslims (84%) in the United States are married to people with the same religion.18

Rates of intermarriage vary considerably among the major U.S. Jewish movements or denominations. Virtually all Orthodox respondents who are married have a Jewish spouse (98%), and most married Conservative Jews also have Jewish spouses (73%). Half of Reform Jews who are married have a Jewish spouse. Among married Jews who have no denominational affiliation, 31% have a Jewish spouse.
The survey also suggests that intermarriage is much more common among Jewish respondents who are themselves the children of intermarriage. Among married Jews who report that only one of their parents was Jewish, fully 83% are married to a non-Jewish spouse. By contrast, among married Jews who say both of their parents were Jewish, 63% have a Jewish spouse and 37% have a non-Jewish spouse.
For a discussion of patterns in child rearing among intermarried and in-married Jews, see Child Rearing Section in Chapter 3.

Age
The survey finds that, on average, Jewish adults are older than the U.S. public as a whole, and Jews by religion are older than Jews of no religion.
Roughly half of Jewish adults (51%) are ages 50 and older, compared with 44% of adults in the general population. Among Jews by religion, 55% are 50 and older, compared with 39% among Jews of no religion.

Among adults, the median age in the Jewish population is 50.19 In the general public, the adult median age is 46. Though Jews of no religion are younger (median age of 43) than Jews by religion (52), they are not as young as the broader religiously unaffiliated population (37).
Orthodox Jews (median age of 40 among adults) are substantially younger than Conservative Jews (55) and Reform Jews (54).
In comparison, the median age of adults in the Christian population is 49, similar to the net Jewish population (50). The adult median age is higher among white evangelical Protestants (53), white mainline Protestants (52) and white Catholics (52).20 The median among Hispanic Catholics (40) and the unaffiliated (37) is comparatively young.
Fertility

Jewish adults ages 40-59 report having had an average of 1.9 children, compared with an average of 2.2 children per adult in the same age cohort of the general public. Jews by religion average more children (2.1) than Jews of no religion (1.5), and the average number of children born to Orthodox Jews (4.1) is about twice the overall Jewish average. By contrast, Reform Jews have 1.7 children and Conservative Jews have 1.8 children, on average. Jewish respondents married to Jewish spouses have more children on average than Jews married to non-Jews (2.8 vs. 1.8), and married Jews have more children than those who have never been married (2.3 vs. 0.2).
While Christians as a whole tend to have more children (2.3) than do Jews (1.9), white evangelical Protestants, white mainline Protestants and white Catholics all average about the same number of children as Jews by religion (2.1). Among Christians, relatively high fertility is found among black Protestants (2.6 children) and Hispanic Catholics (3.1).
These results are based on births reported by male and female survey respondents.21 The number of children ever born to adults ages 40-59 is a good measure of what demographers call completed fertility. In comparisons of childbearing among younger adults across religious groups that vary significantly in educational attainment, it is difficult to determine the extent to which differences in children ever born may be due to differences in the timing of childbearing. By comparing completed fertility, it is possible to see differences that could otherwise be obscured by differences in the timing of childbirth.
Household Composition
On average, Jews live in households with 2.7 people, including 2.2 adults and 0.5 children. Jews by religion and Jews of no religion tend to live in households of similar size (an average of 2.7 people per household among both groups).
Orthodox Jews tend to live in larger households than Jews of other denominational movements. The average Orthodox household contains 1.7 children, compared with 0.3 children per household with a Conservative respondent and 0.4 children per household with a Reform respondent.

Socioeconomic Status

Jews are, on the whole, a comparatively well-educated, high-income group. Nearly six-in-ten adult Jews are college graduates, including 28% who have obtained a post-graduate degree. By comparison, roughly three-in-ten U.S. adults overall are college graduates, including 10% who have a post-graduate degree. Both Jews by religion and Jews of no religion have much higher levels of educational attainment, on average, than does the public overall.
A quarter of Jews, including 26% of Jews by religion and 20% of Jews of no religion, say they have family incomes of $150,000 or more. By comparison, just 8% of U.S. adults overall say their household income is this high.
At the same time, one-fifth of all U.S. Jews report annual household incomes of less than $30,000. Jews with household incomes less than $30,000 are concentrated among young adults and those who have reached retirement age; 38% of Jews under age 30 say they have family incomes of $30,000 or less, as do 24% of Jews 65 and older. By contrast, 16% of Jews ages 30-49 have household incomes of $30,000 or less, and just 11% of Jews ages 50-64 fall into this income bracket. About six-in-ten Reform Jews (61%) and Conservative Jews (62%) say they graduated from college, as do 58% of those with no denominational affiliation. Fewer Orthodox Jews (39%) report having graduated from college, though there are many more college graduates among Modern Orthodox Jews (65%) than among the Ultra-Orthodox (25%).22

Upwards of one-fifth of Jews from all of the major Jewish movements or denominations say they have household incomes of $150,000 or more.
Roughly two-thirds of Jewish adults say they are currently employed. One-third are not employed, including 7% who are currently looking for work. About six-in-ten Jews say they own their home.

Ancestry and Place of Birth

The survey finds that 86% of Jewish adults were born in the United States, including 22% who are the adult children of immigrants and 65% whose families have been in the U.S. for three generations or longer. Roughly one-in-seven Jewish adults (14%) are immigrants, including 5% who were born in the former Soviet Union and 2% who were born in Israel.
In total, 35% of Jewish adults are first- or second- generation immigrants (i.e., are foreign-born or the U.S.-born children of immigrants). Overall, 14% of Jewish adults were born in Europe or had a parent who was born in Europe, and 11% were born in the former Soviet Union or had a parent who was born there. Roughly 4% of U.S. Jews were born in Israel or have a parent who was born in Israel.

Race and Ethnicity
More than nine-in-ten U.S. Jews surveyed describe themselves as non-Hispanic whites, while 2% are black, 3% are Hispanic, and 2% are of other racial and ethnic backgrounds. Racial and ethnic minorities make up a far larger share of the U.S. general population than of the Jewish population.
Geographic Distribution

More than four-in-ten U.S. Jewish adults (43%) live in the Northeast, while 23% reside in the South, 23% in the West and 11% in the Midwest. Compared with Jews by religion, Jews of no religion are less concentrated in the Northeast and more concentrated in the West.
The vast majority of Jews live either in urban areas (49%) or in the suburbs (47%). Just 4% of U.S. Jews reside in rural areas, compared with about one-in-five Americans overall.


