The survey was conducted via face-to-face interviews under the direction of Princeton Survey Research Associates International in Costa Rica, El Salvador, Guatemala, Honduras, Mexico, Nicaragua and Panama, and Ipsos Public Affairs in Argentina, Bolivia, Brazil, Chile, Colombia, the Dominican Republic, Ecuador, Paraguay, Peru, Puerto Rico, Uruguay and Venezuela. The survey is based on samples of non-institutionalized adults ages 18 and older. In some instances, samples exclude minor segments of the population due to accessibility problems or security concerns. In Mexico, an oversample was conducted in the southern states of Chiapas, Tabasco, Campeche and Quintana Roo – states known to have higher concentrations of Protestant Christians.
In all countries, surveys were administered through face-to-face interviews conducted at the respondent’s place of residence. All samples are based on multi-stage cluster designs, which typically entailed proportional stratification by region, locality size and urbanity, selection of primary sampling units (PSUs) proportional to population size, and random selection of secondary and tertiary sampling units within PSUs. Interview teams were assigned to designated random routes at the block or street level and followed predetermined skip patterns when contacting households. Within households, interviewers randomly selected a respondent by using a Kish grid (a random selection from a detailed list of all household members) or by selecting the adult with the next or most recent birthday.
The questionnaire administered by survey interviewers was designed by Pew Research Center staff in consultation with subject matter experts and advisers to the project. The questionnaire was translated into Spanish, Portuguese and Guarani, independently verified by professional linguists conversant in regional dialects and pretested prior to fieldwork.
Following fieldwork, survey performance for each country was assessed by comparing the results for key demographic variables with reliable, national-level population statistics. For each country, the data were weighted to account for different probabilities of selection among respondents. Where appropriate, data also were weighted through an iterative procedure to more closely align the samples with official population figures for gender, age and education. The reported sampling errors and the statistical tests of significance used in the analysis take into account the effects of weighting and specific sample designs.
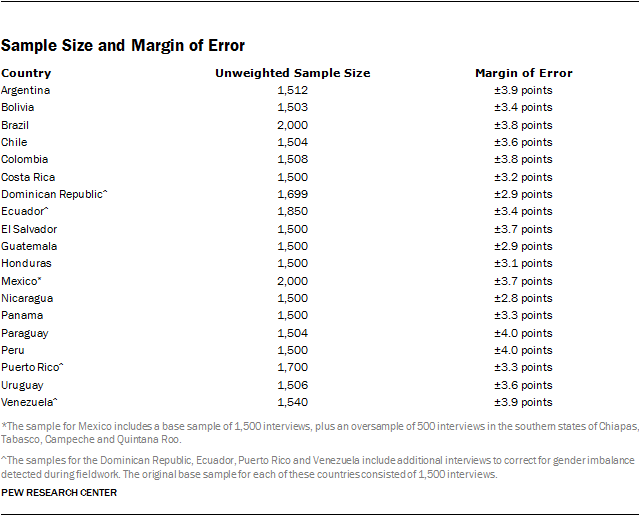
The table below shows the total, unweighted sample size and associated margin of sampling error for each country. For results based on the total sample in the countries surveyed, one can say with 95% confidence that the error attributable to collecting data from some, rather than all, adults living in a country is plus or minus the margin of error. This means that in 95 out of 100 samples of the same size and type, the results obtained would vary by no more than plus or minus the margin of error for the country in question.
It should be noted that practical difficulties in conducting multinational surveys can introduce potential error or bias into the findings. In some countries, fieldwork checks revealed that initial samples were disproportionally female. Further investigation indicated that female interviewers, in particular, had departed from established protocols in order to limit the number of evening hours spent in unfamiliar or threatening neighborhoods. This resulted in fewer interviews with men, who often were not at home during the daytime.
Following this discovery, interviewers in Bolivia, Colombia, the Dominican Republic, Ecuador, Puerto Rico and Venezuela were trained to follow a modified fieldwork protocol that prioritized the selection of men but maintained random selection of respondents. And in the Dominican Republic, Ecuador, Puerto Rico and Venezuela, additional interviews were conducted to reduce the gender skew of the samples. New primary and secondary sampling units were randomly selected for the additional interviews without affecting the overall structure of the sampling design. These corrective fieldwork measures substantially reduced, but did not entirely eliminate, the gender imbalance in the final samples for Bolivia, Colombia, the Dominican Republic, Ecuador, Puerto Rico and Venezuela. Statistical weights were applied to further narrow the gender gap in these countries. Post-field analysis of the survey data revealed that the disproportionate share of female respondents does not influence the substantive survey findings.
In addition to sampling error and other practical difficulties, one should bear in mind that question wording can also have an impact on the findings of opinion polls.
The report is accompanied by a topline survey questionnaire.
Argentina
Sample design: Multi-stage cluster sample stratified by region, locality size and socioeconomic status Mode: Face-to-face adults 18+ Languages: Spanish Fieldwork dates: Nov. 15, 2013–Jan. 8, 2014 Representative: Nationally representative of 99% of the adult population (excluding Tierra del Fuego, inaccessible or sparsely populated areas, and villages with fewer than 400 people) Margin of error: ±3.9 percentage points
Bolivia
Sample design: Multi-stage cluster sample stratified by departments, regional capitals and urbanity Mode: Face-to-face adults 18+ Languages: Spanish Fieldwork dates: Nov. 7, 2013–Feb. 13, 2014 Representative: Nationally representative of 90% of the adult population (excluding villages with fewer than 110 people) Margin of error: ±3.4 percentage points
Brazil
Sample design: Multi-stage cluster sample stratified by region, municipality size and socioeconomic status Mode: Face-to-face adults 18+ Languages: Portuguese Fieldwork dates: Nov. 4, 2013–Feb. 14, 2014 Representative: Nationally representative of 97% of the adult population (excluding remote areas in the Amazon rainforest and interior parts of the Amazonian states) Margin of error: ±3.8 percentage points
Chile
Sample design: Multi-stage cluster sample stratified by provinces/major cities, urban/rural population and socioeconomic status Mode: Face-to-face adults 18+ Languages: Spanish Fieldwork dates: Nov. 11–Dec. 16, 2013 Representative: Nationally representative of 99% of the adult population (excluding remote areas in the Atacama Desert, in mountainous areas, on islands and in the far South) Margin of error: ±3.6 percentage points
Colombia
Sample design: Multi-stage cluster sample stratified by municipality and department size Mode: Face-to-face adults 18+ Languages: Spanish Fieldwork dates: Nov. 28, 2013–March 4, 2014 Representative: Nationally representative of 97% of the adult population (excluding remote areas in the Amazon rain forest and San Andres Island) Margin of error: ±3.8 percentage points
Costa Rica
Sample design: Multi-stage cluster sample stratified by province and urban/rural population Mode: Face-to-face adults 18+ Languages: Spanish Fieldwork dates: Nov. 9–Dec. 19, 2013 Representative: Nationally representative of 99% of the adult population (excluding residents of gated communities and multi-story residential buildings) Margin of error: ±3.2 percentage points
Dominican Republic
Sample design: Multi-stage cluster sample stratified by province and provincial capitals Mode: Face-to-face adults 18+ Languages: Spanish Fieldwork dates: Nov. 2, 2013–Feb. 2, 2014 Representative: Nationally representative of the adult population Margin of error: ±2.9 percentage points
Ecuador
Sample design: Multi-stage cluster sample stratified by region and parish size Mode: Face-to-face adults 18+ Languages: Spanish Fieldwork dates: Nov. 7, 2013–Jan. 26, 2014 Representative: Nationally representative of 98% of the adult population (excluding remote areas in the Galapagos and non-delimited areas between provinces) Margin of error: ±3.4 percentage points
El Salvador
Sample design: Multi-stage cluster sample stratified by department and urban/rural population Mode: Face-to-face adults 18+ Languages: Spanish Fieldwork dates: Nov. 9–Dec. 17, 2013 Representative: Nationally representative of the adult population Margin of error: ±3.7 percentage points
Guatemala
Sample design: Multi-stage cluster sample stratified by department and urban/rural population Mode: Face-to-face adults 18+ Languages: Spanish Fieldwork dates: Nov. 10–Dec. 16, 2013 Representative: Nationally representative of 98% of the adult population (excluding residents of gated communities and multi-story residential buildings) Margin of error: ±2.9 percentage points
Honduras
Sample design: Multi-stage cluster sample stratified by department and urban/rural population Mode: Face-to-face adults 18+ Languages: Spanish Fieldwork dates: Nov. 9–Dec. 19, 2013 Representative: Nationally representative of 98% of the adult population (excluding the Bay Islands department, the small urban populations of five departments and residents of gated communities and multi-story residential buildings) Margin of error: ±3.1 percentage points
Mexico
Sample design: Multi-stage cluster sample stratified by region, urban/rural population and election results Mode: Face-to-face adults 18+ Languages: Spanish Fieldwork dates: Oct. 30–Nov. 12, 2013 Representative: Nationally representative of the adult population, plus a booster sample of 500 adults in four states (Chiapas, Tabasco, Campeche and Quintana Roo) Margin of error: ±3.7 percentage points
Nicaragua
Sample design: Multi-stage cluster sample stratified by department and urban/rural population Mode: Face-to-face adults 18+ Languages: Spanish Fieldwork dates: Nov. 9–Dec. 13, 2013 Representative: Nationally representative of 99% of the adult population (excluding residents of gated communities and multi-story residential buildings) Margin of error: ±2.8 percentage points
Panama
Sample design: Multi-stage cluster sample stratified by province and urban/rural population Mode: Face-to-face adults 18+ Languages: Spanish Fieldwork dates: Nov. 13–Dec. 8, 2013 Representative: Nationally representative of the adult population Margin of error: ±3.3 percentage points
Paraguay
Sample design: Multi-stage cluster sample stratified by district size Mode: Face-to-face adults 18+ Languages: Spanish, Guarani Fieldwork dates: Nov. 26, 2013–Jan. 8, 2014 Representative: Nationally representative of the adult population Margin of error: ±4.0 percentage points
Peru
Sample design: Multi-stage cluster sample stratified by region, locality size and urban/rural population Mode: Face-to-face adults 18+ Languages: Spanish Fieldwork dates: Nov. 13–Dec. 16, 2013 Representative: Nationally representative of 99% of the adult population Margin of error: ±4.0 percentage points
Puerto Rico
Sample design: Multi-stage cluster sample stratified by region, municipality size, urban/rural population and socioeconomic status Mode: Face-to-face adults 18+ Languages: Spanish Fieldwork dates: Nov. 7, 2013–Feb. 28, 2014 Representative: Nationally representative of the adult population Margin of error: ±3.3 percentage points
Uruguay
Sample design: Multi-stage cluster sample stratified by locality size, socioeconomic status and urban/rural population Mode: Face-to-face adults 18+ Languages: Spanish Fieldwork dates: Nov. 22, 2013–Jan. 8, 2014 Representative: Nationally representative of the adult population Margin of error: ±3.6 percentage points
Venezuela
Sample design: Multi-stage cluster sample stratified by states and municipality size Mode: Face-to-face adults 18+ Languages: Spanish Fieldwork dates: Nov. 8, 2013–Feb. 12, 2014 Representative: Nationally representative of 95% of the adult population (excluding regions of Delta Amacuro, Amazonas and Dependecias Federales, as well as 183 parishes deemed inaccessible based on safety conditions at the time of fieldwork) Margin of error: ±3.9 percentage points
Determining Historical Trends in Religious Affiliation
Estimates for the religious affiliation of Latin Americans in 1910, 1950 and 1970 are based primarily on estimates from the World Religion Database (WRD). For Brazil and Mexico, estimates for 1970 are taken from the countries’ censuses. Brazil’s 1950 estimate is based on the country’s 1960 census.
For all estimates, Catholics are made up of all Catholic groups, including independent Catholics not affiliated with the Roman Catholic Church. (Catholics who are not part of the Roman Catholic Church represent a very small share of all Catholics and, at most, change Catholic estimates by one or two percentage points in any given country.) Protestants include those who belong to mainline denominations, Pentecostal churches and independent Protestant churches. Mormons, Jehovah’s Witnesses and Orthodox Christian groups are considered part of an “other Christians” category. Populations with no religious affiliation include atheists, agnostics and those with no religion in particular. Remaining populations of Muslims, Hindus, Buddhists and Spiritists are considered part of an “other religions” category.
Some adjustments to WRD data (1910, 1950 and 1970) were made to ensure a consistent categorization of religious groups across the century. The WRD’s categories of doubly affiliated and disaffiliated Christians, for example, were proportionally subtracted from the population of each Christian group, while unaffiliated Christians were proportionally added to each Christian group. These adjustments were small and did not greatly impact the relative size of each Christian group.
Estimates for 2014 are based on the Pew Research Center’s survey of Latin Americans. These current estimates of religious groups in Latin America are not always consistent with estimates for 2010 published by the Pew Research Center in its Global Christianity and Global Religious Landscape reports. Differences among the reports should be interpreted with caution, however, as some of the discrepancies fall within the reported margin of error for individual countries (+ 2.8% to 4%, depending on the country).
Post-stratification survey weights for gender, age and education were used to better align survey data with available population figures. In some countries, however, partial weights were used. Very few differences for the religious affiliation of the country or across demographic groups exist when results using partial weights are compared with fully weighted data.
Historical religion estimates rely on population estimates for each Latin American country. Population sizes were estimated by applying the shares of each religious group by Latin American country to country population totals supplied by the World Religion Database for 1910 and the United Nations Population Division (2012 revision) for remaining years. While estimates from the WRD are for the entire population, religious affiliation estimates of younger children (typically under the age of 5) are not available in the Brazilian or Mexican census. Consequently, the religious breakdowns of younger children in Brazil and Mexico are assumed to be the same as the rest of the population. Similarly, the 2014 survey only surveyed the adult population (age 18 and older); consequently, the religious breakdown of each country’s minor population is assumed to be the same as its adult population.
Finally, missing data for religious affiliation in censuses or the 2014 survey (often for less than 2% of the population) are not included in the estimates; therefore, it is assumed that the religious distribution of people not indicating their religious affiliation is the same as that for the entire population.


