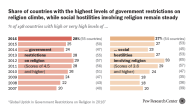
Hindus were the largest religious group in the Asia-Pacific region as of 2010, with about 1 billion adherents. While the number of Hindus is expected to grow to nearly 1.4 billion by 2050, Muslims are projected to grow even faster and become the largest religious group in the region by mid-century. The Muslim population in Asia and the Pacific is expected to increase by almost 50% to nearly 1.5 billion in 2050.57
The number of people in the region who are religiously unaffiliated is expected to decrease between 2010 and 2050, falling from nearly 860 million to about 838 million. While the Asia-Pacific region will continue to be home to the vast majority of all Buddhists in the world, the number of Buddhists in the region also is projected to drop (from 481 million in 2010 to 476 million in 2050). Meanwhile, the Christian population in Asia and the Pacific is expected to grow by about 33%, rising from 287 million in 2010 to 381 million in 2050.

Muslims are projected to make up nearly 30% of the region’s population in 2050, up from 24% in 2010. Hindus also are expected to increase as a share of the region’s population, rising from 25% in 2010 to nearly 28% in 2050. The Christian share of the population is expected to increase slightly, from just over 7% to nearly 8%. The growth of these religious groups can be traced mostly to their relatively young populations and high fertility rates.
By contrast, older populations and relatively low fertility rates are factors in why the share of the region’s population with no religious affiliation is projected to decline from 21% in 2010 to 17% in 2050. Similarly, the Buddhist share of the Asia-Pacific population is expected to drop from nearly 12% in 2010 to less than 10% in 2050. The proportion of the region’s population belonging to folk religions also is forecast to decline, from 9% in 2010 to about 7% in 2050.
Factors Driving Change
Fertility

The Total Fertility Rate of Muslims in the Asia-Pacific region is 2.6 children per woman in the 2010 to 2015 period, considerably higher than the region’s overall fertility rate of 2.1 children. Fertility rates also were relatively high for Hindus (2.4) and Christians (2.3). By contrast, fertility rates for Buddhists (1.6), the religiously unaffiliated (1.6) and adherents of other religions (1.6) all were below the replacement level of approximately 2.1 children per woman.
Age Structure
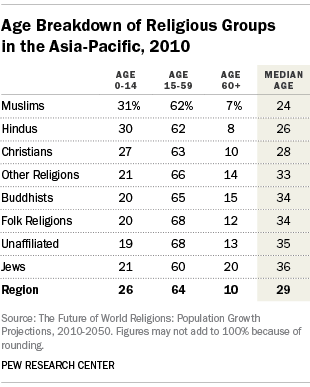
The groups projected to grow in population size in the Asia-Pacific region had relatively young populations in 2010. The median ages of Muslims (24), Hindus (26) and Christians (28) all were lower than the regional median age (29) and considerably younger than the median age of adherents of other religions (33) and folk religions (34), as well as Buddhists (34), the religiously unaffiliated (35) and Jews (36) in the region.
Religious Switching
The population projections in this report incorporate patterns in religious switching in 13 countries in the Asia-Pacific region for which there was reliable data on the number of people who say they no longer belong to the religious group in which they were raised. Reliable data on religious switching were unavailable for China and India, the most populous countries in the region. (For more details, see the Methodology.)
The size of religious groups in the Asia-Pacific region as a whole did not change appreciably whether or not switching was included in the projection models, which is why the data are not shown. (This does not mean that there were no discernible differences at the country level.)
Migration
In the decades ahead, more migrants are expected to move out of the Asia-Pacific region than move into it. This outbound movement is not anticipated to make a large difference in the overall religious composition of the region, however, given the large number of people in each of the major religious groups. Consequently, the report does not show different projection scenarios with and without migration for this region.