Muslim Americans constitute a population that is rare, dispersed and diverse. It includes many recent immigrants from multiple countries with different native languages who may have difficulty completing a public opinion survey in English. The intense attention paid to Muslims in the aftermath of terrorist attacks in the U.S. and abroad, as well as the Trump administration’s efforts to temporarily restrict travel from a number of Muslim-majority countries, may have made some more reluctant to cooperate with a survey request from an unknown caller. Collectively, these characteristics present significant challenges to anyone wishing to survey this population.
Despite the challenges, Pew Research Center was able to complete interviews with 1,001 Muslim American adults 18 years old and older. Interviews were conducted by telephone between Jan. 23 and May 2, 2017, by the research firm Abt Associates. To help overcome the challenges described above, the survey was offered in Arabic, Farsi, and Urdu in addition to English, and the questionnaire was specially designed to build rapport between respondents and interviewers before delving into more sensitive content.
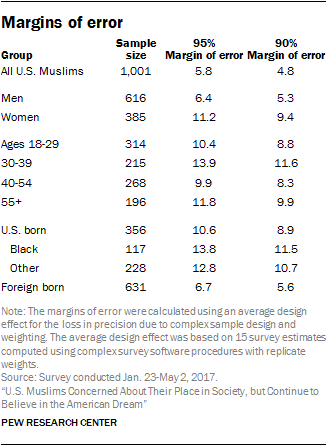
The foundation of the survey was a scientific sampling design in which every residential phone number in the U.S. had a known probability of being selected for the study. After taking into account the complex sample design, the average margin of sampling error on the 1,001 completed interviews with Muslims is +/- 5.8 percentage points at the 95% level of confidence.33 This section describes how the study was designed and executed.
Sample design
Stratification
One of Pew Research Center’s goals in this study was to interview a sample of at least 1,000 American Muslims. In random-digit dial (RDD) surveys of the English-speaking U.S. population, roughly 1% of respondents typically identify as Muslim in response to a question about their religious identity. This means that if the Center had relied exclusively on national RDD sampling techniques, it would have had to interview and screen roughly 100,000 people in order to identify and recruit a sample of 1,000 Muslims. Such an approach is impractical. Instead, researchers used existing data on the Muslim American community and on telephone users more generally to design a sampling plan that reached and interviewed a nationally representative sample of Muslim Americans more efficiently than a simple RDD approach would have done.34
The first step in designing the sampling plan involved using several sources of data to estimate the share of the population that is Muslim for each county (or county equivalent) in the U.S. One key resource in this effort was the Pew Research Center database of more than 150,000 telephone interviews conducted between 2011 and 2016. Another resource was data from the American Community Survey (ACS), which is an annual survey conducted by the U.S. Census Bureau. The Census Bureau does not collect information about religion, but the ACS does include measures of ancestry, national origin for immigrants, and languages spoken. These measures were used to analyze the geographic distribution of adults who are from (or whose ancestors are from) countries with significant or majority Muslim populations, or who speak languages commonly spoken by Muslims.
The other data sources used to create county-level estimates were the 2010 Religious Congregations and Membership Study, county-level counts of flagged likely Muslim telephone numbers provided by Survey Sampling International, and a dataset of county-level official statistics (e.g., educational attainment, housing stress, economic activity) archived by the Inter-university Consortium for Political and Social Research. Survey designers at Abt Associates used a statistical approach known as small-area estimation to take these various data and estimate the density of Muslims in each county.
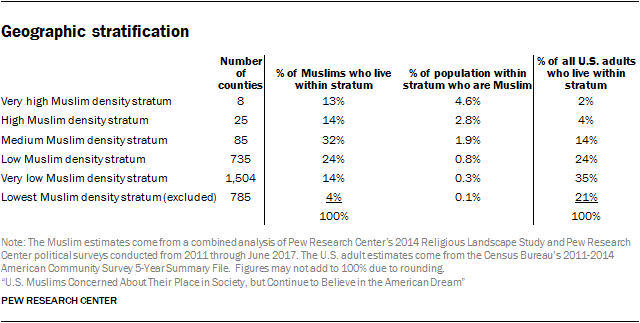
The next step was sorting all of the counties in the U.S. into six different groups, or geographic strata, based on the estimated incidence of Muslims. Eight counties were placed in the “very high” geographic stratum. These eight counties are home to just 2% of all U.S. adults (according to Census data), but to 13% of all U.S. Muslim adults (according to Pew Research Center surveys conducted since 2011), and Muslims account for nearly 5% of the population in these counties.35 The second highest density stratum, the “high” stratum, consists of 25 counties that are home to just 4% of all U.S. adults but to 14% of all U.S. Muslims; Muslims account for nearly 3% of the population in these counties.
At the other end of the spectrum, the lowest density geographic stratum includes 785 primarily rural counties which are home to 21% of all U.S. adults, but just 4% of all U.S. Muslims and where Muslims account for just 0.1% of the overall population. These counties were excluded from the geographic strata, though the study includes partial coverage of Muslims living in this stratum through the use of flagged sample (described below) and because some people (including some Muslims) have phone numbers associated with one of the higher strata but actually reside in the lowest density stratum.
In addition to sorting the country into six geographic strata based on the density of the Muslim population in a given area, the study made use of a seventh stratum of phone numbers that have been flagged by third-party data vendors as likely to belong to a Muslim. In early 2017, 2.3 million out of the roughly 500 million possible cellphone numbers in the U.S. had this flag, as did nearly 400,000 of the roughly 300 million possible landline numbers in the U.S.
The flags are based on consumer information gathered from a variety of sources. Muslim flags were assigned to the cellphone frame using Ethnic Technologies’ algorithm, which is based on first names, middle names, surnames, prefixes, suffixes and geographic location. For the landline frame, Muslim flags were assigned using a proprietary SSI algorithm based on first, middle and last names, and geographic location. Relative to the random samples of telephone numbers in various counties, the numbers in the flagged strata are much more efficient for reaching Muslim adults. While the flags are far from perfect – only about three-in-ten adults reached via a flagged number self-identified as Muslim – the interviewing hours needed per Muslim interview within the flagged strata are a tiny fraction of the hours required to complete a Muslim interview when dialing numbers in the other strata.
The Muslims reached via the flagged stratum do not, in themselves, constitute a nationally representative sample of Muslim Americans. For example, Muslims with flagged telephone numbers are somewhat better educated, more likely to be foreign born, more likely to be Asian by race (and less likely to be black), and more likely to be lifelong Muslims (as opposed to converts) when compared with Muslim Americans as a whole.
However, because the study employed a probability-based design, proper weighting (described below) corrects for these issues. For example, the chance that a given Muslim with a flagged number was selected for this study was roughly 11 times greater than the chance of selection for a Muslim with an unflagged phone number in the very low density stratum. To correct for this, Muslim respondents were weighted according to the inverse of their chance of selection. For example, in the weighted dataset, each respondent from the very low density stratum is weighted up to represent about 11,191 Muslims while each respondent from the flagged stratum is weighted to represent only about 985 Muslims. In other words, each interview from the very low density stratum has about 11,191/985=11 times more influence on the survey estimates than each interview from the flagged stratum (to correct for the fact that their chance of selection was 11 times lower).
In the same manner, weighting adjusts for the oversampling of geographic strata with higher Muslim incidence and undersampling of geographic strata with lower Muslim incidences (as detailed in the next section). This approach to sampling – developing a stratification plan, oversampling high density strata, and then making statistical adjustments so that the various strata are represented in their proper proportions in weighted estimates – is very common in survey research involving rare populations. For example, it has been used in the U.S. Department of Veterans’ National Survey of Veterans and UCLA’s California Health Interview Survey.
Sample allocation and deduplication
Once the strata were defined at the county level and through the use of the flags as described above, the next step in the sampling process involved employing an optimization algorithm to allocate the interviewing across the six geographic strata and the flagged stratum. The algorithm maximized the expected precision of the survey (specifically the effective sample size) factoring in the different Muslim incidence levels in various strata, as well as the loss in precision stemming from weighting adjustments.
At this point, a sample of cellphone numbers was drawn from within each geographic stratum (except the lowest density stratum). The numbers were drawn from the list of all residential cellphone numbers in the United States. These numbers were then compared to the entire set of cellphone numbers from the flagged stratum. Any numbers that appeared in both a geographic stratum and the flagged stratum were removed from the former, and were available to be sampled only as part of the flagged stratum.
This process was then repeated for landline numbers, except that no telephone numbers were drawn that were associated with the low, very low, or lowest strata within the landline frame. The decision to refrain from dialing landline numbers in these strata was based on the extremely low rate at which interviews done on landlines in these areas have yielded interviews with Muslim respondents. In recent Pew Research Center surveys, for instance, just one in 1,323 respondents interviewed on a landline in the lowest stratum has been Muslim.
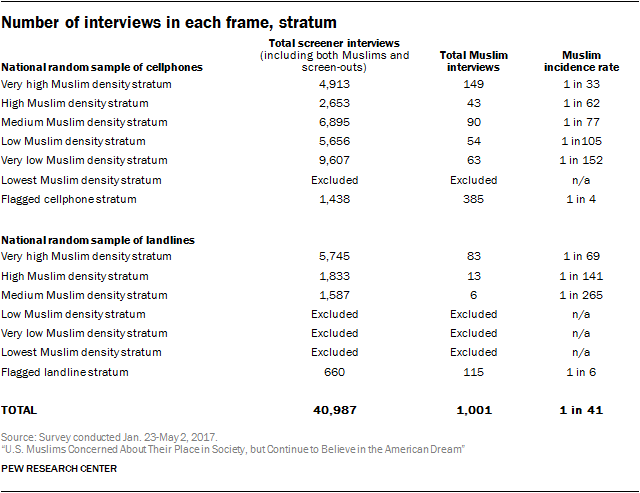
The strength of this research design was that it yielded a probability sample. That is, each adult in the U.S. had a known probability of being included in the study. The fact that some persons had a greater chance of being included than others (e.g., because they live in places where there are more Muslims) is taken into account in the statistical adjustment described below. In total, 40,987 screening interviews were completed as part of this study. Of these, 1,001 respondents identified themselves as Muslim and completed the full interview.
Overall, the estimated coverage rate for Muslim Americans provided by the study, accounting for the excluded strata, is over 90%.
Weighting
Overview
Several stages of statistical adjustment (weighting) were needed to account for the study’s complex sample design. The dataset in which the weights were created included all of the adults screened for the study who completed the demographics module. This included all of the 1,001 Muslim respondents and 20,102 adults who screened out as non-Muslim but were subsampled (at a 50% rate) to complete the demographics module.
The first part of the weighting featured a series of adjustments to correct for the fact that the chance of selection into the study differed across U.S. adults. For example, adults who had both a landline and cellphone, who live in one of the oversampled geographies, or have a phone number flagged as servicing a Muslim household were overrepresented in the unweighted data. The weighting corrects for these features, as detailed below.
The virtue of retaining the 20,000+ non-Muslims in the weighting is that it made it possible to complete the next step in the weighting process: aligning the survey sample to the demographic profile of all U.S. adults. The Census Bureau publishes highly accurate data for all noninstitutionalized U.S. adults. No such data are available for the Muslim American population. Aligning the “all adult” sample to demographic benchmarks helps to address the fact that different subgroups tend to participate in surveys at different rates (i.e., differential nonresponse). This way, the weighted sample of all adults (Muslims and non-Muslims) is representative of the U.S. with respect to variables such as age, gender, education, region, race and ethnicity.
Prior to analysis, two additional steps were taken. The non-Muslim cases were dropped from the dataset, leaving just the 1,001 Muslim interviews. Then replicate weights were created so that appropriate standard errors and significance tests could be computed. The remainder of this section describes in detail how the weight was computed.
Base weighting
As discussed above, the sample design featured 10 strata – four strata in the landline frame and six strata in the cellphone frame. The first weighting adjustment corrected for the fact that telephone numbers in some strata were sampled at a relatively high rate (oversampled) and telephone numbers in other strata were sampled at a relatively low rate (undersampled). Specifically, if Nh is the total count of telephone numbers on the sampling frame in stratum h and nh is the count of numbers sampled from that stratum, then the first weighting adjustment was computed as

The next adjustment corrects for the fact that the response rate was higher in some strata and lower in other strata. Specifically, if Sh is the count of phone numbers sampled in stratum h that yielded a completed screener interview, Eh is the count of sampled phone numbers in stratum h that were known to be eligible for screening (e.g., working and residential), and Êh is the count of sampled phone numbers in stratum h for which eligibility was unknown but are estimated36 to be eligible for screening, then the second weighting adjustment was computed as

The next adjustment corrected for the fact that the non-Muslims in the dataset represent only half of all of the non-Muslim adults screened. To avoid unnecessary data collection, only 50% of the non-Muslims (n=20,102) were administered the demographics module. To correct for that subsampling, the third weighting adjustment (w3) multiplies the weights for the non-Muslim cases by 2 and does nothing to the weights for the Muslim cases (multiplication by 1).37

The fourth weight adjustment concerned only landline cases. It adjusted for the fact that landline respondents who live in a household with multiple adults were less likely to be interviewed than landline respondents who live alone. For example, if a household with a landline sampled for this study had four adults living in it, then all four adults were eligible for the survey, but we only interviewed one of them, meaning that three were not selected. By contrast, when we called a landline number used by someone who lives alone, that person was selected every time. In order to avoid underrepresenting people who live in multi-adult households, the fourth adjustment multiplied the weight for landline cases by the number of adults living in the household (Ai).

As per standard survey practice, this adjustment was capped so that highly unusual cases (e.g., a respondent living in a 15-person household) are not overly influential in the survey estimates. The cap was four adults for non-Muslim cases and five adults for Muslim cases, reflecting the fact that prior studies have shown that Muslim Americans tend to have larger households than non-Muslim Americans. For cellphone cases, this adjustment was set to 1, which means it made no change to the weight value. When cellphone numbers were dialed, the person answering the phone was automatically selected for the survey, provided that they were 18 years old or older.
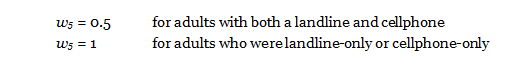
The next step was to account for the overlap between the landline and cellphone sampling frames. Adults with both a residential landline and a cellphone (“dual service”) could potentially have been selected for the survey in both frames. In other words, they had a higher chance of being selected for the survey than adults with just a landline or just a cellphone. To correct for that, the weighting adjusts down dual users so that they are not overrepresented in the survey. The specific approach used in this survey, composite estimation,38 combines the interviews with dual users from the landline sample and the interviews with dual users from the cellphone sample using a weighted average. The two groups of dual users were weighted equally, a common specification to reduce the variance of the weighted estimates.
The adjustments detailed above were applied to create the full base weight, which was used as the input weight for the raking procedure.
Raking adjustment for differential nonresponse and noncoverage
The sample of non-Muslims and Muslims was then balanced to control totals for the noninstitutionalized U.S. adult population using a process called raking. The sample was balanced to match national population parameters for sex × region of birth, sex × age, sex × education, age × education, census region of residence, race/ethnicity, race/ethnicity × census region of residence, race/ethnicity × education, and telephone usage. The region of birth variable contained seven categories: U.S. (native born), Americas (excluding the U.S.), South Asia, other Asia/Pacific, Europe, Middle East/North Africa, and sub-Saharan Africa.
In typical public opinion polls of 1,000 U.S. adults, it is not possible to adjust the sample to such a detailed target for birth region because several of the adjustment cells would be empty due to their extremely low incidence (e.g., less than 1% of adults living in the U.S. were born in sub-Saharan Africa). For this study, the very large screener sample size and the oversampling of urban areas with relatively high shares of immigrant populations allowed adjustment on this dimension so that the weighted sample of screened adults was representative in terms of where they were born.
The population targets were computed from several sources. The telephone usage parameter was a projection based on June-December 2016 estimates from the National Health Interview Survey (NHIS) conducted by the Centers for Disease Control and Prevention. The sex × region of birth target was computed from the 2011-2015 American Community Survey five-year public use microdata sample (PUMS). The other raking targets were computed from the 2015 American Community Survey. After this calibration was performed, all the non-Muslim cases were dropped from the analysis. A light trim was applied to the weights of the Muslim cases so as to constrain the variance of the weights. Weight values larger than the 99.8th percentile were capped (winsorized) at the 99.8th percentile. All of the weights were then re-scaled so that the sum of the weights was unchanged. Analysis of Muslim Americans in the body of the report uses this trimmed weight, with the exception of the estimate of the population total. The untrimmed weight in the full screener dataset of Muslims and non-Muslims, in combination with data from the Current Population Survey, was used to produce the estimated population total.
Variance estimation
Due to the complex design of the Muslim American study, formulas commonly used in RDD surveys to estimate margins of error (standard errors) are inappropriate. Such formulas would understate the true variability in the estimates. Accordingly, analyses in this report used a repeated replication technique, specifically jackknife repeated replication (JRR), to calculate the standard errors. Repeated replication techniques estimate the variance of a survey statistic based on the variance between subsample estimates of that statistic. The subsamples (replicates) were created using the same sample design, but deleting a portion of the sample, and then weighting each subsample up to the population total. A total of 100 replicates were created. A statistical software package designed for complex survey data, Stata, was used to calculate all of the standard errors and test statistics in the study.
Questionnaire design
As with the 2007 and 2011 surveys of Muslim Americans, the goal of the study was to provide a broad description of the characteristics and attitudes of the Muslim American population. Thus, the questionnaire needed to cover a wide range of topics but be short enough that respondents would be willing to complete the interview.
Much of the content was drawn from the 2007 and 2011 surveys so that any changes in attitudes could be tracked. New questions also were taken from other Pew Research Center U.S. surveys to provide comparisons with the U.S. public. And some questions were developed specifically for this new survey.
One issue confronted in the questionnaire design was the possibility that members of this population are reluctant to reveal their religious identification because of concerns about stereotyping and prejudice. Both the 2007 and 2011 surveys show that many U.S. Muslims believe they are targeted by the government for surveillance and some also report personal experiences with discrimination and hostility. Several features of the questionnaire were tailored to deal with these concerns.
The initial questions were chosen to be of a general nature in order to establish rapport with respondents, asking about presidential approval, satisfaction with the way things are going in the country, satisfaction with their personal lives and financial situations, homeownership, and educational attainment. After these items, respondents were asked about their religious identity, choosing from a list that included Christian, Jewish, Muslim, Hindu, Buddhist or “something else.” Respondents who identified as Muslim proceeded to the substantive portion of the questionnaire. Those identifying with a religion other than Islam (or with no religion) were randomly assigned to receive a short set of demographic questions to be used for weighting or to have the interview discontinued.
Respondents who declined to answer the question about their religion when first asked were directed to a module of questions about their life goals, about their views on a few social and political topics, about their views of President Trump, and about discrimination against various groups in American society before being asked again about their religious identity. This approach was adopted in the hopes that the intervening questions between the first asking about religion and the second asking would help develop a good rapport between the respondent and the interviewer and thus increase the likelihood that a Muslim respondent who was initially reluctant to self-identify as Muslim would ultimately do so. Overall, 970 of the Muslims in the survey identified as Muslim when first asked about their religion, and 31 did so when asked about their religion for the second time.
At this point in the interview, respondents were told: “Just to give you a little more background, Pew Research Center conducts surveys of many religious groups, including Christians, Jews, Hindus and many others. Earlier, you mentioned that you are Muslim. We have some questions about the views and experiences of Muslims in the U.S. that I think you will find interesting. As a token of our appreciation for your time, we can send you $50 at the completion of the survey.”39
The logic for revealing the principal research focus of the study – a practice not common in survey research – was that respondents would quickly discover that the study was focused on Muslims and Islam, and that there would be a greater chance of establishing trust and rapport by revealing the intent of the study before asking questions specific to experiences as a Muslim or about the Islamic faith.
Overall, 71% of respondents identified in the screening interview as Muslim eventually completed the survey. This completion rate is somewhat lower than average for other Pew Research Center surveys, where completion rates of 80% to 85% are more common. But given that the mean survey length was 33 minutes (13 minutes longer than the typical survey conducted by the Center), a breakoff rate that was somewhat higher than normal was not unexpected. The 71% completion rate does not include respondents who dropped off during the short screener interview prior to answering the religion question.
Pilot test and pretest
In the summer of 2016, Pew Research Center conducted a pilot test of telephone numbers (both cellphones and landlines) in the flagged strata. The pilot test consisted of administering a very short questionnaire to 200 respondents in each frame (cellphone and landline) and was designed to determine what share of numbers in the flagged strata belong to a Muslim respondent.
Two pretests of the full questionnaire were conducted, one in December 2016 (among 30 Muslim respondents in the flagged stratum) and another in January 2017 (among 28 Muslim respondents in the flagged stratum). Changes were made to the questionnaire and interviewer training procedures based on the results of the pretests.
Survey administration
The administration of this survey posed several challenges. For example, the volume of interviewing was very large. The survey firm, Abt Associates, conducted the interviewing over a 14-week timeframe. A total of 40,987 households were screened. This was achieved by deploying 652 interviewers.
Because the U.S. Muslim population includes many immigrants who have arrived in the U.S. relatively recently, the survey was translated and conducted in three languages (in addition to English) identified as among the most commonly spoken among Muslim immigrants to the U.S. — Arabic, Farsi and Urdu. Translation of the questionnaire was accomplished via a three-step process including translation by a professional translator under the direction of Abt Associates, an independent review by a second translator retained by Pew Research Center, and the reconciling of concerns and discrepancies in collaboration with the bilingual interviewers. A total of 953 interviews were conducted with Muslims in English, 30 in Arabic, eight in Farsi and 10 in Urdu.
Multilingual interviewers on staff were utilized for the project. Additional multilingual interviewers were recruited, tested by an accredited vendor on their language proficiency, then evaluated and scored before being interviewed and hired by Abt Associates. All non-English interviewers first go through the standard Abt Associates initial training process that all interviewers go through. Bilingual interviewers with more proficiency and interviewing experience were given supervisory roles; they worked with the interviewers in their language to monitor surveys, assist in training and debrief.
An incentive of $50 was offered to respondents near the beginning of the survey, after it was determined that the respondent identified as Muslim in a response to a question about religious affiliation. The decision to offer an incentive was based on two principal considerations. First, the survey entailed a substantial time commitment for respondents. Second, incentives have been repeatedly shown to increase response rates, a critical consideration in studies of rare populations where substantial effort is devoted to locating qualified respondents.40 The use of incentives has been shown to be particularly helpful in improving participation among reluctant respondents. Most respondents (78%) asked to receive the incentive payment.
To mitigate potential gender biases in the composition of the sample, the interviewing protocols for landline households attempted to match male interviewers with male respondents and female interviewers with female respondents. This practice is common among survey researchers conducting face-to-face interviews in majority Muslim nations. Interviewer-respondent gender matching was not implemented, however, when calling cellphone numbers, because cellphones are predominantly used as a personal (rather than household) device.
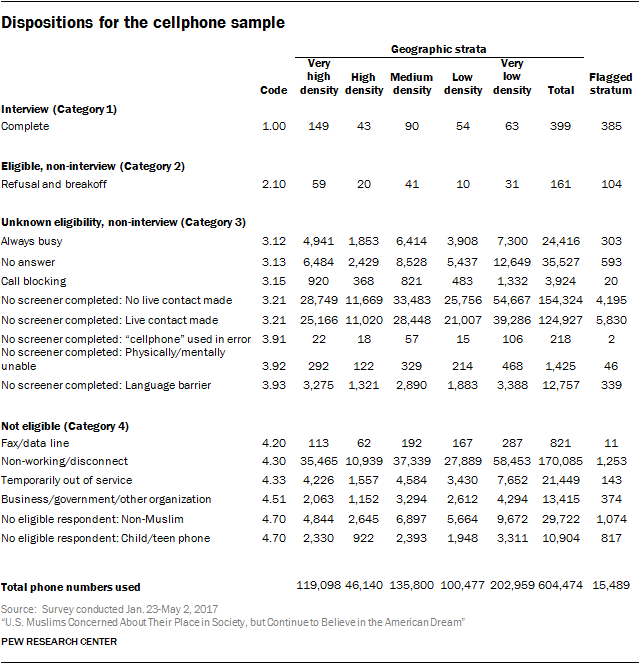
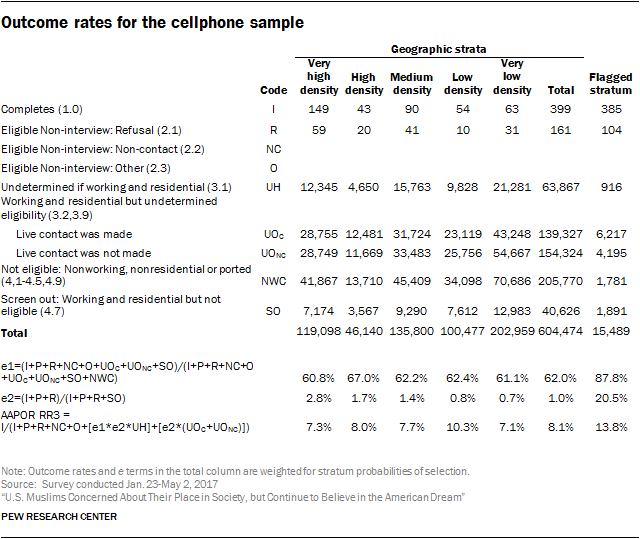
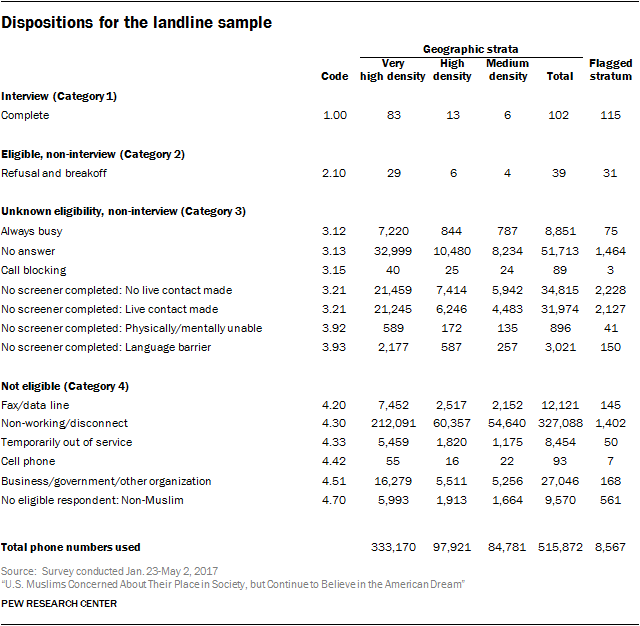
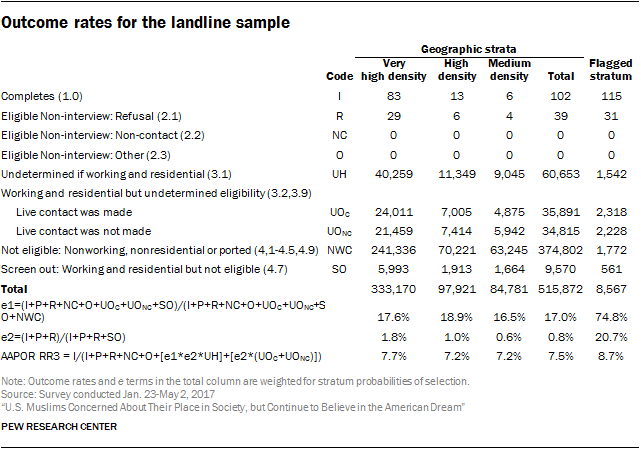
The screening effort yielded a response rate of 8.1% for the geographic cell strata, 7.5% for the geographic landline strata, 13.8% for the flagged cell stratum, and 8.7% for the flagged landline stratum, using the Response Rate 3 definition devised by the American Association for Public Opinion Research (AAPOR). Detailed AAPOR sample disposition reports are provided at the end of this section.
Surveys of the U.S. general public
In addition to summarizing the findings of the survey of Muslim Americans, this report contains previously unreleased questions from several surveys conducted among the U.S. general public. These include a telephone survey conducted April 25 to June 4, 2017, among a national sample of 5,002 adults ages 18 and older who live in all 50 U.S. states and the District of Columbia (1,250 respondents were interviewed on a landline telephone and 3,752 were interviewed on a cellphone, including 2,284 who had no landline telephone). The survey was conducted by interviewers at Abt Associates. A combination of landline and cellphone random-digit dial samples were used; both samples were provided by Survey Sampling International. Interviews were conducted in English and Spanish. Respondents in the landline sample were selected by randomly asking for the youngest adult male or female who is now at home. Interviews in the cell sample were conducted with the person who answered the phone, if that person was 18 years of age or older.
The combined landline and cellphone sample was weighted using an iterative technique that matches gender, age, education, race, Hispanic origin and nativity, and region to parameters from the 2015 Census Bureau’s American Community Survey and population density to parameters from the decennial census. The sample also is weighted to match current patterns of telephone status (landline only, cellphone only, or both landline and cellphone), based on extrapolations from the 2016 National Health Interview Survey. The weighting procedure also accounts for the fact that respondents with both landline and cellphones have a greater probability of being included in the combined sample and adjusts for household size among respondents with a landline phone. The margin of error at the 95% level of confidence for results based on the full sample from this survey is +/- 1.5 percentage points. Sample sizes and sampling errors for subgroups are available upon request. The margins of error reported and statistical tests of significance are adjusted to account for the survey’s design effect, a measure of how much efficiency is lost from the weighting procedures.
Along with the survey conducted April 25 to June 4, 2017, other general public findings published for the first time in this report include data from surveys conducted April 5 to 11, 2017, and February 7 to 12, 2017. Information about the methods used to conduct those surveys is included in Pew Research Center reports “Public Dissatisfaction With Washington Weighs on the GOP” and “In First Month, Views of Trump Are Already Strongly Felt, Deeply Polarized.” For detailed information about Pew Research Center’s general public survey methodology, see https://www.pewresearch.org/methodology/u-s-survey-research/
Pew Research Center undertakes all polling activity, including calls to mobile telephone numbers, in compliance with the Telephone Consumer Protection Act and other applicable laws.
Pew Research Center is a nonprofit, tax-exempt 501(c)(3) organization and a subsidiary of The Pew Charitable Trusts, its primary funder.