
How we did this
Over the past several years, Pew Research Center has changed the way it conducts surveys in the United States. The Center’s polls were once conducted entirely using an interviewer-administered mode: Respondents were called by telephone and invited by a professional interviewer to participate in the poll. As response rates to telephone surveys continued to decline in recent years and the challenges (and costs) of telephone surveys grew, the Center gradually transitioned to surveys conducted using a self-administered mode, in which respondents participate in polls conducted online. Today, most of the Center’s surveys are conducted online.
This shift has significant implications for interpreting the Center’s long-term trend data on the country’s religious characteristics. Can estimates from surveys done using the new methods be directly compared with estimates from previous surveys done using the older methods to understand whether and how the country’s religious attributes have changed? Or are the new methods simply too different from the older methods to draw firm conclusions about how things have changed?
To help answer these questions, this report analyzes and compares data from three different sources: The aggregated set of all of the telephone surveys the Center conducted between January 2019 and July 2020; the annual profile survey (conducted Aug. 3 to 16, 2020) the Center administers to respondents in its American Trends Panel, an online survey panel recruited through national, random sampling of residential addresses; and the 2020 National Public Opinion Reference Survey (NPORS), conducted online and by mail June 1 to Aug. 11, 2020.
For additional details, see the methodology section of this report.
For most of its history, Pew Research Center has conducted its U.S. polling by telephone – nationally representative samples of respondents were contacted via random-digit dialing (RDD) and invited to participate in surveys conducted by live interviewers (that is, not by computer-generated recordings). Over time, however, declining response rates and rapidly rising costs have made it increasingly difficult to conduct surveys by telephone, with people more reluctant to answer phone calls from unknown numbers.1
In 2014, Pew Research Center established its American Trends Panel (ATP) to respond to these challenges. The ATP is a nationally representative group of more than 13,500 U.S. adults recruited by phone or mail who have agreed to participate in online surveys conducted approximately once or twice per month. Since the establishment of the ATP, the Center has gradually migrated away from telephone polling and toward online survey administration, and since early 2019, the Center has conducted most of its U.S. polling on the ATP.
This shift has major implications for the way the Center measures trends in American religion – including those from the Center’s flagship Religious Landscape Studies, which were conducted by phone in 2007 and 2014. In recent years, figures from the ATP have not matched those from telephone surveys on some key measures – even when questions are asked exactly the same way. For example, when asking Americans about their religious affiliation, the ATP has found a higher share of people who do not identify with any religion. And the ATP has found a much lower share of people who say they regularly attend religious services than RDD surveys do.
In other words, the ATP consistently produces estimates that suggest the U.S. population is less religious, in a variety of ways, than RDD telephone surveys indicate. And the big differences between the Center’s new ATP-based estimates and its older RDD-based estimates greatly complicate efforts to track change over time in the U.S. public’s religious characteristics. So how might we understand and interpret these differences between the ATP and RDD surveys?
One possible cause of the differences is the mode in which a survey is administered: RDD surveys are conducted using an interviewer-administered mode, in which respondents answer questions posed by another person, while ATP surveys are conducted using a self-administered mode, in which respondents answer questions online. Survey respondents tend to indicate higher levels of religiosity when answering questions from a live interviewer than when filling out a survey by themselves (either on paper or online).2 This is because, when representing themselves to another person, some people may (consciously or subconsciously) project a more highly religious image of themselves than when they are filling out a survey alone and unobserved. This “mode effect” reflects, in part, that being religious has long been considered a socially desirable attribute in America.3
The psychology behind these different answers is not simply a matter of being truthful versus lying. On some questions, there may be more than one truthful way to answer. Take religious affiliation, for instance. There are many different opinions about what makes someone Christian, Jewish, Muslim, Hindu or Buddhist. But no matter what anyone else thinks is correct, surveys typically rely on respondents’ self-identification to measure religious identity. If the same person says she is Christian in one survey and unaffiliated in another, it is not necessarily the case that she was honest in one and dishonest in the other; she may have a tenuous link to Christianity, and in some contexts she calls herself a Christian while in other contexts she does not – without even thinking about it. The same is true when it comes to assessing the importance of religion in one’s life, a standard question in many surveys about religious and spiritual matters. There are no objectively correct or incorrect answers – whether a respondent describes religion as “somewhat” or “not too” important to them, for instance, could depend on what happened that day or who is asking the question.
Religious service attendance is a bit different, since in theory, at least, there is a verifiably true answer to the question of how often a person goes to a house of worship. Still, when respondents in a telephone or face-to-face survey overstate how often they go to religious services, they may not be consciously telling a lie so much as projecting a self-image that is important to them. They may be saying, in effect, “I’m the kind of person who goes to church every week” rather than, “Without fail, I actually go to church every single week.” When answering the same question online, without the subtle psychological impact of speaking to another person, respondents evidently give answers that are closer to their actual behavior.4
Another potential factor in the differences between the ATP and RDD surveys is the rate of response among key groups in the U.S. population. Compared with RDD surveys, some people may be less likely to participate in ATP surveys, especially the portion of the population that would prefer other options to doing a survey online. This is known as “differential nonresponse.”
Today, all ATP surveys are conducted online. When respondents are recruited to join the ATP, they are asked whether they have access to the internet in their home. If they do not have internet access, Pew Research Center offers to provide it (including a tablet device and a subscription for internet service) so that they can participate in the ATP.
Despite these efforts to include households that would otherwise not use the internet, it is possible that people who are less comfortable participating in online surveys may decline to participate in the ATP at higher rates than people who are confident and comfortable using the internet for this purpose. Research shows that Americans who do not use the internet at all tend to be older than the general population, and older adults tend to be more religious, on average, than younger adults. And while people who do not use the internet at all constitute a small (and shrinking) share of the overall U.S. population, it may nevertheless be the case that the ATP misses people who go online sometimes for some purposes but who are unenthusiastic about doing so to participate in a survey. To the extent that it comes up short in representing the population of Americans who use the internet on a limited basis or not at all – or who would simply prefer other options (such as telephone or paper surveys) to participating in surveys online – the ATP may underestimate the country’s religiosity.
The National Public Opinion Reference Survey (NPORS)
In 2020, Pew Research Center conducted a National Public Opinion Reference Survey (NPORS). The NPORS was designed in part to help explain the different estimates of religiosity produced by the ATP and RDD surveys, and to assess the degree to which mode effects and differential nonresponse might be factors. The NPORS was conducted among a representative group of U.S. adults recruited by drawing a national random sample of home addresses (known as address-based sampling, or ABS) and offering the ability to respond either online or via paper and pencil.5 This approach is the best available for representing all U.S. adults – including those who are comfortable participating online as well as those who are not. The NPORS achieved a 29% response rate, which is more than 20 percentage points higher than the Center’s RDD polls or online panels like the ATP.
The NPORS survey included questions on a variety of topics, including internet usage patterns and political partisanship. It also featured several queries about religion that the Center has long asked in its RDD and ATP surveys, including questions about religious affiliation (such as Protestant, Catholic, Jewish, Muslim, atheist and others), frequency of attendance at religious services, frequency of prayer, and the importance of religion in respondents’ lives.
The results of the NPORS suggest that the ATP may have overstated the share of religious “nones” in the U.S. population, and that differential nonresponse may be primarily to blame. In other words, the ATP may underrepresent a portion of the population that would participate in surveys by paper and pencil (if given the option) but would be reluctant to be surveyed online, and which is presumably more highly religious than the rest of the U.S. public.
Virtually all surveys must adjust their datasets to correct any imbalances between the survey sample and the population being surveyed. For example, highly educated people tend to be more likely than those with lower levels of education to participate in surveys. Thus, survey samples have to be adjusted, or “weighted,” to ensure that educational attainment and other demographic attributes of the survey samples match the broader population’s known characteristics.
The most prevalent method for weighting public opinion surveys involves choosing a set of variables where the population’s characteristics are known, and then employing a statistical procedure that iteratively adjusts the weight for each respondent until the survey sample aligns with the known characteristics of the population. For example, a researcher might specify that the sample should be 48% men and 52% women, or that a sample should be 43% Protestant, 19% Catholic and 27% religiously unaffiliated. The process will adjust the weights so that the gender ratio for the weighted survey sample matches the known population characteristics. Next, the weights are adjusted so that the religious groups are in the correct proportion. If the adjustment for religion pushes the gender distribution out of alignment, then the weights are adjusted again so that men and women are represented in the desired proportion. The process is repeated until the weighted distribution of all of the weighting variables matches or comes close to matching their specified targets (results will not always be exact).
More details about weighting survey datasets are available here.
As a result, Pew Research Center has decided, for the foreseeable future, to adjust (or “weight”) ATP samples to religious affiliation parameters derived from the NPORS. Once the ATP sample is weighted to religious affiliation targets derived from the NPORS, analysis shows that the ATP and RDD surveys produce very similar estimates of the share of U.S. adults who pray regularly, suggesting that future ATP estimates of prayer frequency can be compared with older RDD surveys to track change over time. After weighting, the ATP also produces estimates of the importance Americans attach to religion that are in the same ballpark as a recent RDD survey – though not as close as the measure of frequency of prayer.
The ATP is not the only national online survey platform to statistically adjust on religion. For example, the Cooperative Congressional Election Study, funded by the National Science Foundation, has also used religion measures in both its sample matching and weighting.
On the other hand, the NPORS finds very similar rates of religious attendance to the ATP, and both sources (the NPORS and the ATP) indicate that regular religious attendance is far less common than indicated by RDD surveys. This finding – an apparent mode effect – suggests that RDD surveys overestimate the share of U.S. adults who attend religious services in any given week due to what researchers call social desirability bias.
When respondents participate in a survey conducted by a live interviewer (either in person or on the telephone), they may (perhaps subconsciously) wish to present themselves in the best possible light on a range of topics. That is, as in any other social interaction, a respondent being interviewed for a survey may want the interviewer to think highly of them.This phenomenon is not limited to questions about religion. On a range of questions, respondents tend to overstate the degree to which they participate in certain kinds of socially desirable activities, such as how often they volunteer in their communities, the frequency with which they vote in elections, or the amount of attention they pay to news about current events.
Similarly, respondents may downplay the frequency with which they engage in socially undesirable behaviors (such as using drugs or drinking alcohol) or the degree to which they hold socially undesirable opinions (such as racist or sexist attitudes). When this happens, it introduces social desirability bias – systematic overestimates of socially desirable characteristics and underestimates of socially undesirable traits – into survey results.
This comes as no surprise: Researchers have long known that surveys in which live interviewers ask respondents questions about their frequency of attendance at religious services produce overestimates of the share of U.S. adults who attend services in any given week. This is partly because while questions about religious attendance ostensibly ask about a behavior, some respondents may interpret them as questions about identity. Respondents who do not actually go to religious services every week may nevertheless think of themselves as regular worship attenders, and so describe themselves in the context of a survey interview as weekly religious attenders.6
While this means results from the newer self-administered surveys should not be directly compared with those from RDD phone surveys, there is good reason to think that by reducing social desirability bias, self-administered measurement of religious attendance (like in the NPORS and the ATP) produces more candid and accurate answers than interviewer-administered surveys.
The remainder of this report compares recent RDD surveys with the NPORS and ATP surveys (both before and after the ATP samples are weighted to NPORS targets) in more detail. It concludes with a discussion of what these findings mean for understanding trends in American religion and monitoring those trends in the future.
Measuring religious affiliation
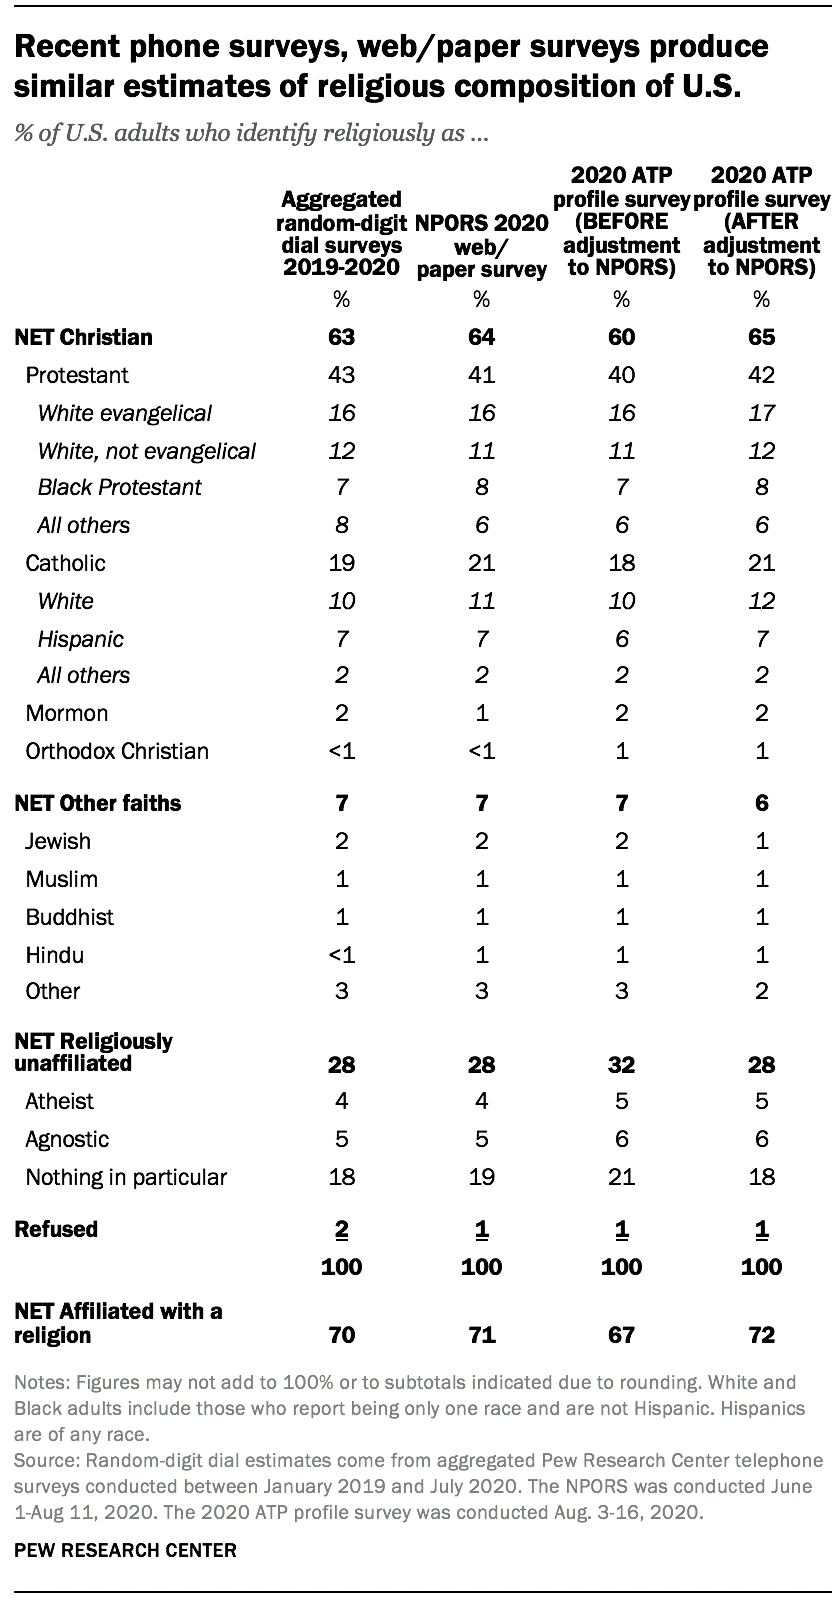
Random digit-dial telephone surveys show that religious “nones” (people who describe themselves, religiously, as atheist, agnostic, or simply “nothing in particular”) have been growing as a share of the U.S. adult population and Christians have been declining for quite some time. In the Center’s most current RDD polling, 63% of U.S. adults identify as Christians (including 43% who are Protestant, 19% who are Catholic, and 2% who are Mormon), and 28% are “nones” (including 4% who describe themselves as atheists, 5% who are agnostics, and 18% who are “nothing in particular”). By way of comparison, in the Center’s polling from roughly a decade ago, in 2009, 77% of U.S. adults described themselves as Christians (14 percentage points higher than today), and 17% described themselves as religious “nones” (11 points lower than today).
The 2020 NPORS paints a portrait of the country’s religious composition that is very similar to the findings of the Center’s recent RDD surveys. In the NPORS, 64% of respondents self-identify as Christian, and 28% are religious “nones.” This suggests that in the future, studies like the NPORS (that is, surveys that use address-based sampling and offer both online and offline response options) can be validly compared with older RDD surveys to track change over time in the country’s religious composition.
By comparison with both recent RDD surveys and the NPORS, the ATP finds a modestly but significantly higher percentage of respondents who identify as religious “nones” and fewer Christians. In the 2020 ATP profile survey (the latest in a series of surveys conducted annually in which all current, active ATP members are asked to provide updated information about a variety of personal characteristics, including their religious identities and behaviors), 60% of respondents described themselves as Christians (3 points lower than in recent RDD surveys and 4 points lower than in the NPORS), and 32% described themselves as religious “nones” (4 points higher than in recent RDD surveys and the NPORS).
The differences in the religious composition of ATP and NPORS respondents suggests that the higher share of religious “nones” in the ATP is a function not of mode effects (since both surveys are self-administered), but rather of insufficient representation of people who would prefer not to participate in online surveys in the ATP as compared with the NPORS. As a result, Pew Research Center has decided to weight the ATP sample to religious affiliation targets derived from the NPORS for the foreseeable future. That is, in addition to the standard weighting controls for age, gender, race/ethnicity, education and more, ATP samples will be weighted so as to ensure that they match the NPORS-derived religious composition of U.S. adults on each of four major categories: Protestant, Catholic, religiously unaffiliated (or religious “nones”), and other.7 When this additional weighting is done, the religious affiliations of ATP respondents look very much like those in the NPORS (by definition) and also very much like those in recent RDD surveys.
Measuring religious attendance
Just as affiliating with a religion has grown less common in recent years, so too has attending religious services, according to RDD surveys. In the Center’s most recent RDD surveys, 55% of U.S. adults say they attend religious services a few times a year or less, up from 47% who said this a decade ago.
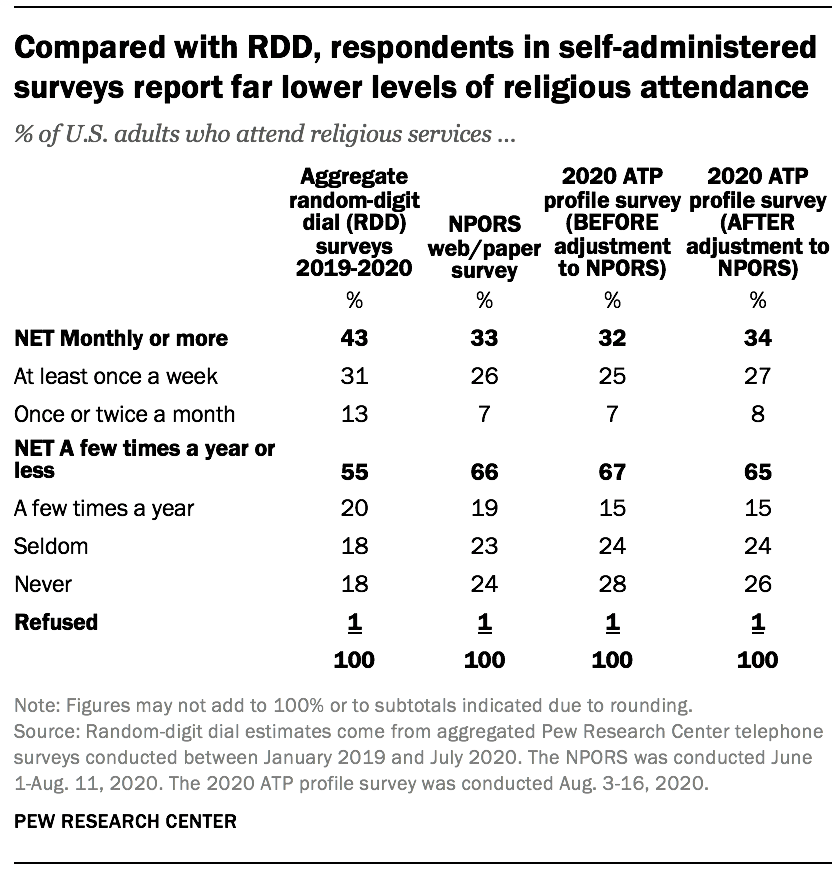
But the NPORS finds even lower rates of worship attendance than RDD polls do. Only a third of NPORS respondents (33%) report attending religious services at least once a month, compared with 43% in RDD surveys. And the NPORS respondents are much more likely to report rarely or never attending; 66% of NPORS respondents report attending a few times a year or less, vs. 55% in RDD surveys.
Furthermore, the ATP estimates of rates of religious attendance look almost identical to the NPORS estimates (both before and after adjusting the ATP sample to NPORS-based targets for religious affiliation). The fact that the estimates from these two self-administered surveys are similar to each other – and both much different from the estimates based on the interviewer-administered RDD surveys – points to social desirability bias in the RDD surveys as the reason for inflated estimates of self-reported religious attendance in telephone polls.
The NPORS was conducted during the midst of a global pandemic when many religious congregations were holding limited in-person services or closed altogether. Thus, it is worth considering whether fewer people reported regular attendance because of the circumstances of the pandemic. However, the ATP finds very little difference in self-reported patterns of religious attendance between a major survey conducted in summer 2019 (before the pandemic), when 31% reported attending monthly or more and 69% reported attending yearly or less, and a major survey conducted in summer 2020 (during the pandemic), when 32% reported attending monthly or more and two-thirds reported attending yearly or less.
This suggests that, at least for the time being, respondents are reacting to the question about religious attendance – “Aside from weddings and funerals, how often do you attend religious services?” – by describing their general attendance patterns in more typical times, and not necessarily by indicating whether they’ve been attending in-person religious services during the pandemic. As a result, it appears safe to compare results from the 2020 NPORS with pre-pandemic ATP data.
Measuring how often people pray and their assessments of religion’s importance
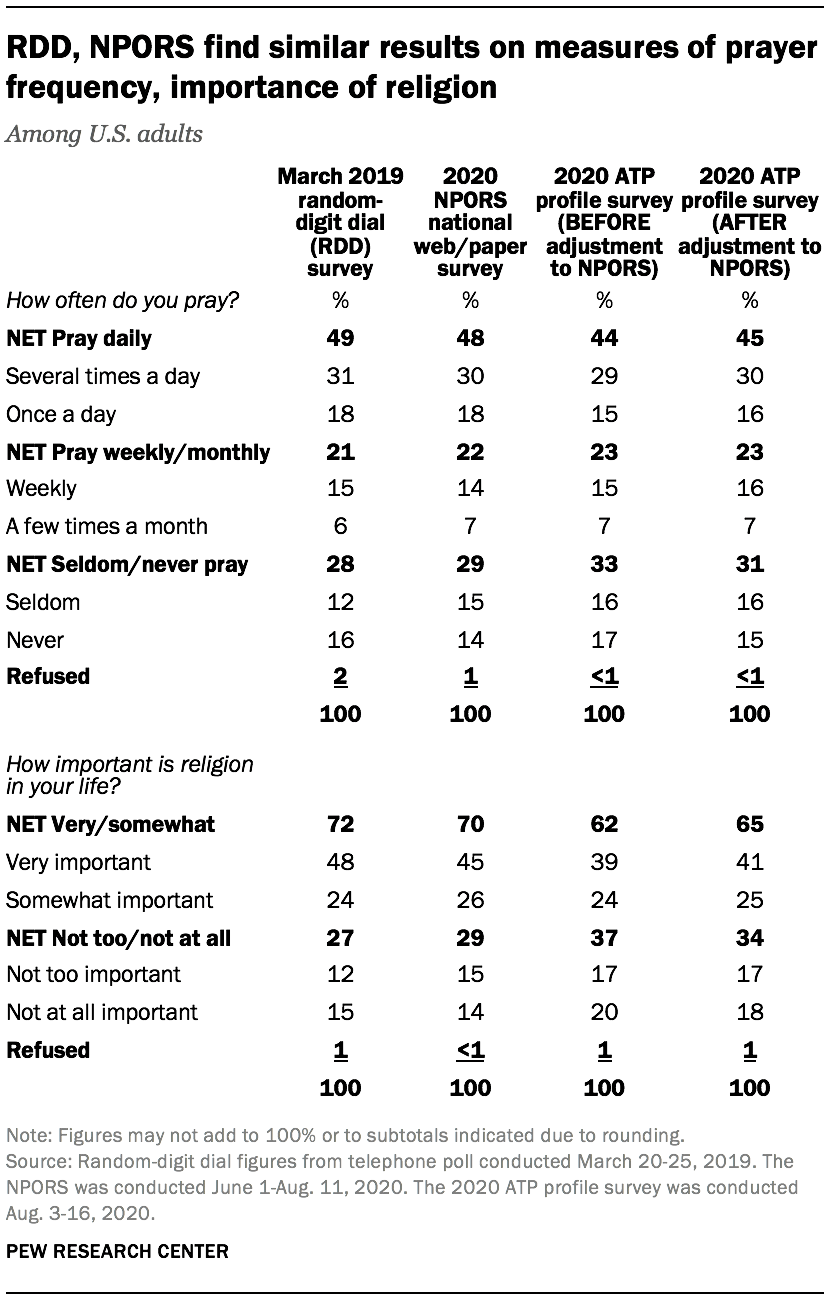
Random-digit dial phone surveys and the NPORS produce similar estimates of the share of Americans who say they pray daily; 49% of respondents in a 2019 RDD survey report that they pray at least once a day, as do 48% of participants in the NPORS. After adjusting to NPORS-based targets for religious affiliation, the ATP produces estimates of prayer frequency that are only slightly lower than both sources, with 45% of ATP respondents saying they pray daily.
RDD polls and the NPORS also produce similar estimates of the share of Americans who say religion is “very important” in their lives (48% in a March 2019 RDD survey, 45% in the NPORS). On this measure, the ATP produces a somewhat lower estimate of the share of U.S. adults who consider religion very important (41%), even after weighting to NPORS-based religious affiliation targets. Still, the differences between the ATP and NPORS-based estimates are relatively modest. And all three sources find that nearly two-thirds or more of U.S. adults say religion is at least “somewhat” important in their lives.
Implications
In the future, Pew Research Center is likely to continue to conduct more self-administered surveys (especially using the ATP and also via periodic NPORS-style studies) and fewer RDD telephone polls. This poses complications for continuing RDD-based trends, including those produced by the Center’s flagship Religious Landscape Studies conducted in 2007 and 2014. Those studies have shown that the country has been growing less religious over time, continuing trends first observed in the General Social Survey (GSS) as long ago as the early 1990s.8 These major developments in American religion include the decline of the Christian share of the population, the growth of religious “nones,” and a downturn in self-reported rates of religious attendance.
But the new data suggests that future surveys conducted using address-based sampling methods and a mail push-to-web design with a mail/paper option (like the NPORS) are valid tools for continuing RDD-based efforts from previous years to monitor trends and ongoing changes in the country’s religious composition. Additionally, the data shows that once it is anchored to benchmarks like those produced by the NPORS, the ATP produces estimates of the country’s religious composition that are very similar to those produced using RDD techniques.
Similarly, self-administered surveys that ask respondents how often they pray produce similar estimates to RDD surveys and can be interpreted as a continuation of RDD-based trends. The situation is a bit less clear with respect to the importance respondents attach to religion in their lives, and future self-administered surveys that show lower estimates of religion’s importance may need to be interpreted cautiously, because they could reflect mode effects rather than real change over time. That said, big reductions in the share of Americans who say religion is very important to them in the future can probably be interpreted as indicators of continuing declines in the country’s religiosity, and the reversal of any such trends can confidently be interpreted as a slowing or reversal of secularizing trends.
Estimates of the frequency with which Americans attend religious services derived from self-administered surveys are clearly not comparable with those produced by phone surveys. Even after adjusting the religious composition of the ATP sample to parameters derived from the NPORS, the ATP produces far lower estimates of the share of regular religious attenders than RDD surveys. This means future surveys conducted using self-administered modes cannot be compared with past surveys conducted over the phone to assess change over time in the share of Americans who regularly attend religious services. But there is reason to believe these new NPORS- and ATP-based estimates of religious attendance may more accurately reflect Americans’ behavior, and they will serve as important baselines for monitoring trends on this important topic using these methods in the years ahead.


