Black Americans constitute a population that is multicultural, regionally distinctive and often underrepresented in surveys. While most national public opinion surveys allow researchers to study attitudes among all Black adults (treated as one group), deeper analysis tends to be limited. Sample sizes often are too small to support reliable estimates for young Black adults as well as older ones, those not attending college as well as those with degrees, Black Republicans as well as Black Democrats, and so on. Moreover, as surveys are increasingly conducted online, many exclude people without reliable internet service. This can be particularly damaging for research on older populations or those with lower incomes.
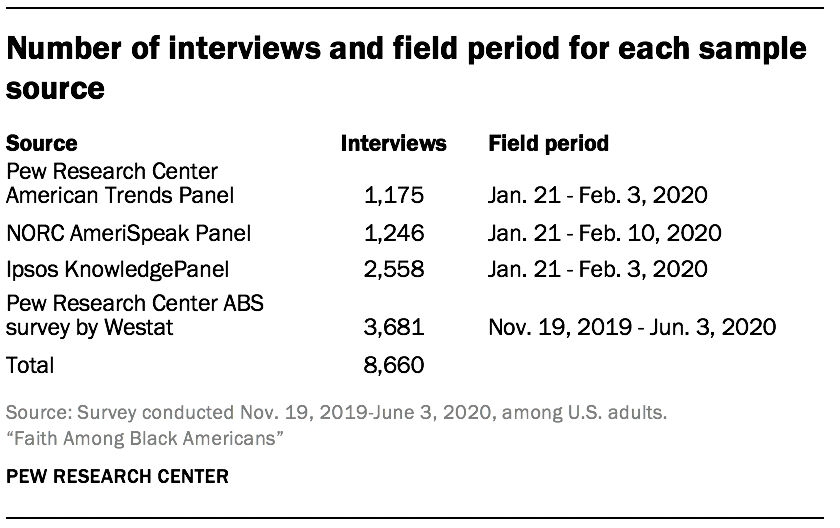
With this study, Pew Research Center sought to overcome these limitations and uncover new insights about the religious beliefs and practices of Black adults. Researchers surveyed a total 8,660 Black adults using a combination of four, high-quality, probability-based samples. The study also featured multiple response modes: online, a paper version or live telephone. The modes that were offered varied by sample as detailed below. The combined analytic sample supports reliable analysis even of hard-to-reach segments within the Black American population. An additional 4,574 interviews were conducted with adults who are not Black to facilitate comparison with the full, U.S. adult population.
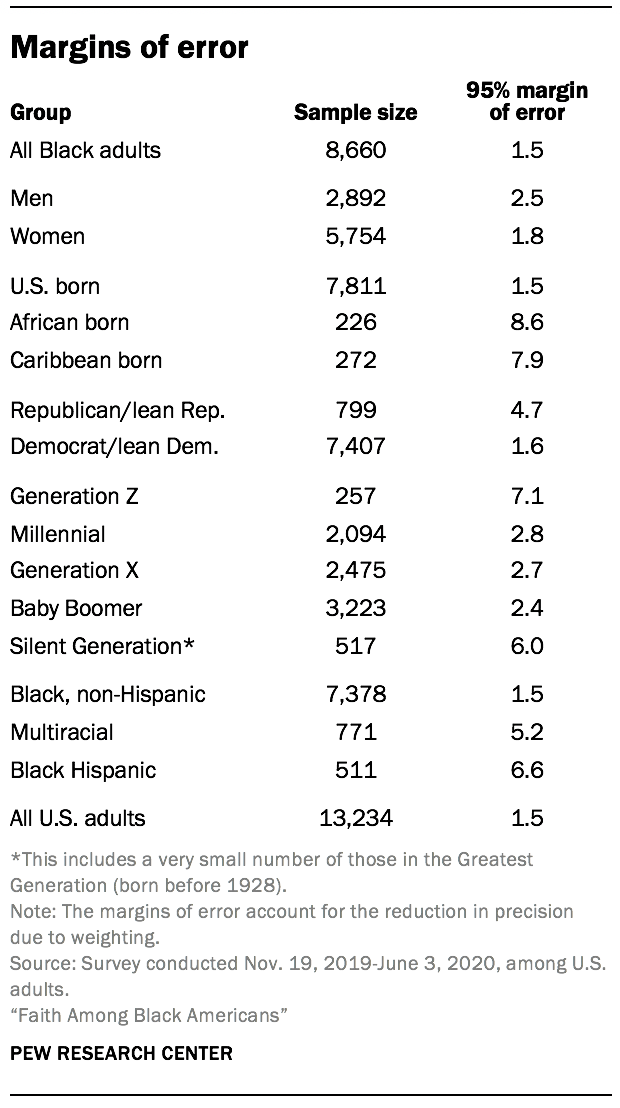
Responses were collected from Nov. 19, 2019, to June 3, 2020, but most respondents completed the survey between Jan. 21, 2020, and Feb. 10, 2020. All self-identified Black or African American adults were eligible, including those who identify as Black and another race, or Black and Hispanic. The survey is weighted to be representative of the U.S. Black adult population by sex, ethnicity, partisan affiliation, education and other categories. The survey was conducted in English and Spanish. After accounting for the reduction in precision from weighting, the margin of sampling error on the 8,660 completed interviews with Black adults is +/-1.5 percentage points at the 95% level of confidence. This appendix describes how the study was designed and executed.
Sample design
One of Pew Research Center’s goals in this study was to interview a sample of Black Americans large enough to study the diversity of views within this group. To achieve this large, nationally representative sample, the study leveraged four sources. Three are probability-based survey panels, and one was a custom address-based sampling (ABS) survey conducted for Pew Research Center.
The study includes samples from three survey panels because these are an efficient way to interview national, random samples of Black adults who have already agreed to take surveys on an ongoing basis. By contrast, the strength of the ABS survey is not efficiency but precision. Unlike survey panels, which are designed for general population polling, the ABS survey was purpose- built to interview not just Black Americans but harder-to-reach segments within the larger group. This meant focusing extra resources in areas with sizable foreign-born Black populations.
While each sample was recruited using somewhat different methods, they shared three important features: a common questionnaire; a common population of inference, which is Black Americans ages 18 and older living in the 50 U.S. states or District of Columbia; and probability-based random sampling. By carefully tracking the chance that each respondent had of being selected, it was possible to combine the samples in a way that preserved proper representation of the entire population. A description of each sample source is provided below. The subsequent weighting section describes the steps used to combine the samples.
The American Trends Panel sample
The American Trends Panel (ATP), created by Pew Research Center, is a nationally representative panel of randomly selected U.S. adults. Panelists participate via self-administered web surveys. The panel is being managed by Ipsos. Panelists who do not have internet access at home are provided with a tablet and wireless internet connection. The ATP was created in 2014, and initially recruited via landline and cellphone random-digit-dial (RDD) telephone sampling. In August 2018, the ATP switched from telephone to address-based recruitment. Invitations are sent to a random, stratified address-based sample (ABS) of households selected from the U.S. Postal Service’s Computerized Delivery Sequence File (CDSF). The CDSF has been estimated to cover as much as 98% of the population, although some studies suggest that the coverage could be in the low 90% range.53
In each sample household, the adult with the next birthday is asked to go online to complete a survey, at the end of which they are invited to join the panel. Of the 23,440 individuals who had ever joined the ATP, 15,463 remained active panelists and continued to receive survey invitations at the time this survey was conducted. Additional information about the sample design and recruitment procedures for the ATP is available here. Data in this report is drawn from the panel survey conducted Jan. 21 to Feb. 3, 2020. The survey featured a stratified random sample of active ATP members in which Black panelists were sampled with certainty. The remaining panelists were subsampled at rates designed to achieve a target sample size of 5,500 total interviews. A total of 5,499 ATP members ultimately completed the survey, of whom 1,175 were Black. While not the primary focus of this report, the 4,324 non-Black respondents are combined with Black respondents from all four sources in the weighting to enable comparisons with the full U.S. adult population.
The NORC AmeriSpeak Panel sample
Funded and operated by NORC at the University of Chicago, AmeriSpeak® is a probability-based panel designed to be representative of the U.S. household population. Households are sampled from the NORC National Frame and address-based sample. The NORC National Frame provides sample coverage for over 97% of U.S. households. To provide sample coverage for states where the National Frame is not operative, a secondary source is address-based sampling.
AmeriSpeak recruitment is a two-stage process: initial recruitment using less-expensive methods and then nonresponse follow-up using personal interviewers. For the initial recruitment, sample units are invited to join AmeriSpeak online by visiting the panel website AmeriSpeak.org or by telephone (inbound/outbound supported). English and Spanish language are supported for both online and telephone recruitment. Panel invitations are communicated via a pre-notification postcard, a USPS recruitment package, two follow-up post cards and contact by NORC’s telephone research center for sample units matched to a telephone number.
The second-stage nonresponse follow-up targets a stratified random subsample of the nonresponders from the initial recruitment. Units sampled for the nonresponse follow-up are sent by FedEx a new recruitment package with an enhanced incentive offer. NORC field interviewers then make personal, face-to-face visits to the respondents’ homes to encourage participation. NORC field interviewers administer the recruitment survey in person or else encourage the respondents to register at AmeriSpeak.org or call the toll-free AmeriSpeak telephone number to register. Additional information about the sample design and recruitment procedures for the AmeriSpeak panel are available here.
Data in this report is drawn from the panel survey of 1,246 Black adults conducted Jan. 21 to Feb. 10, 2020. For this study, all households containing an individual who identified as Black (including Black Hispanics and those who are multiracial) were selected from the panel. If a panel household had one more than one active adult panel member, only one adult in the household was eligible for selection (random within-household sampling).
The Ipsos KnowledgePanel sample
The Ipsos KnowledgePanel is an online probability-based panel representative of the U.S. adult population. Households without internet connection are provided with a web-enabled device and free internet service. KnowledgePanel’s recruitment process was originally based on a national RDD sampling methodology. In 2009, the panel switched to using an ABS methodology via the CDSF.
Samples from the CDSF are selected using disproportionate stratified sampling. Adults from sampled households are invited to join KnowledgePanel through a series of mailings, including an initial invitation letter, a reminder postcard and a subsequent follow-up letter. Given that a subset of physical addresses can be matched to corresponding landline telephone numbers, about five weeks after the initial mailing, telephone refusal-conversion calls are made to nonresponding households for which a telephone number is matched. Additional information about the sample design and recruitment procedures for the Ipsos KnowledgePanel are available here.
The KnowledgePanel sample in this study consisted of members who self-identified as Black, including, but not limited to identifying as Black and Hispanic or multiracial where one of the races is Black. Ipsos fielded this sample jointly with the American Trends Panel sample, which they also administer, from Jan. 21 to Feb. 3, 2020. In total, 2,558 Black adults from KnowledgePanel completed the survey.
The Pew Research Center ABS survey
The final sample source was a national cross-sectional, ABS survey conducted for Pew Research Center by Westat. This survey was fielded Nov. 19, 2019, through June 3, 2020, resulted in 3,681 completed interviews with Black adults.54 This was a large, two-stage screening survey designed to identify individuals who were eligible for either the survey of Black Americans that is the focus of this report or a separate survey of Jewish Americans (not yet published). The small number of respondents who were eligible for both surveys were randomly assigned to one or the other and their survey weights were adjusted accordingly. This was done primarily for efficiency since both populations make up a relatively small share of the total U.S. adult population and obtaining a sufficient sample size for either group requires screening a much larger number of adults.
The survey had a complex sample design constructed to maximize efficiency in reaching Black and Jewish adults while also supporting reliable, national estimates separately for these two populations. This sample design is discussed in detail here (and at greater length than the panel samples) because these details are not available elsewhere online.
The study used a stratified, systematic sample of U.S. residential mailing addresses. The ABS frame originates from the CDSF updated every month. That frame is maintained by Marketing Systems Group (MSG). MSG geocodes their entire ABS frame, so block, block group and census tract characteristics from the decennial census and the American Community Survey (ACS) can be appended to addresses and used for sampling and data collection purposes. The stratification of the sampling frame and the assignment of differential sampling rates to the strata were a critical design component because of the rareness of the eligible populations. Because the Jewish population was much rarer than the Black population, the stratification mainly identified areas with high concentrations of Jewish adults.
The first source for identifying areas with a higher density of Jewish adults was a file made available to Pew Research Center by the American Jewish Population Project (AJPP) at Brandeis University. The U.S. government does not collect data that classifies people by religion, so the AJPP data is the best source available. The AJPP provided pre-release data for this purpose (Pre-Release Estimates, July 2019). The available tables were at the county or county-group level and had estimates of both the total number of adults and the proportion of adults who identified themselves as Jewish by religion for each county-group. Based on the distribution of the proportion of Jewish adults by religion in the county-groups, Westat partitioned the county-groups into two classes based on estimated Jewish density (high and low).
The next step was to stratify the areas within the county-groups in the high-density class. Pew Research Center provided data from surveys conducted in 2013 or later that contained the respondent’s religious affiliation, ZIP code and sampling weights. Westat used that data to estimate the proportion of Jewish adults at the ZIP code level. Unfortunately, the Census Bureau does not report population counts at the ZIP code level. Instead, the Census Bureau reports counts at the ZIP Code Tabulation Areas (ZCTAs) level. Westat implemented a crosswalk between ZCTA and ZIP codes and then produced estimates of the proportion of Jewish adults at the ZCTA level within county-groups for those county-groups in the high-density class.
Since the sample sizes in the ZCTAs from the Pew Research Center surveys were often very small, zero or missing, the estimates of the percentage of Jewish adults in the ZCTA were not precise. As a result, each county-group in the High-density class was partitioned into just two pieces within the county-group. The first part included all ZCTAs with the highest estimated percentage of Jews by religion in the county-group, and the other having the remainder ZCTAs. Westat assigned all high-density ZCTAs to stratum 1. The lower-density ZCTAs were placed in stratum 2. The county-groups or individual counties in the low-density class were placed in stratum 3.
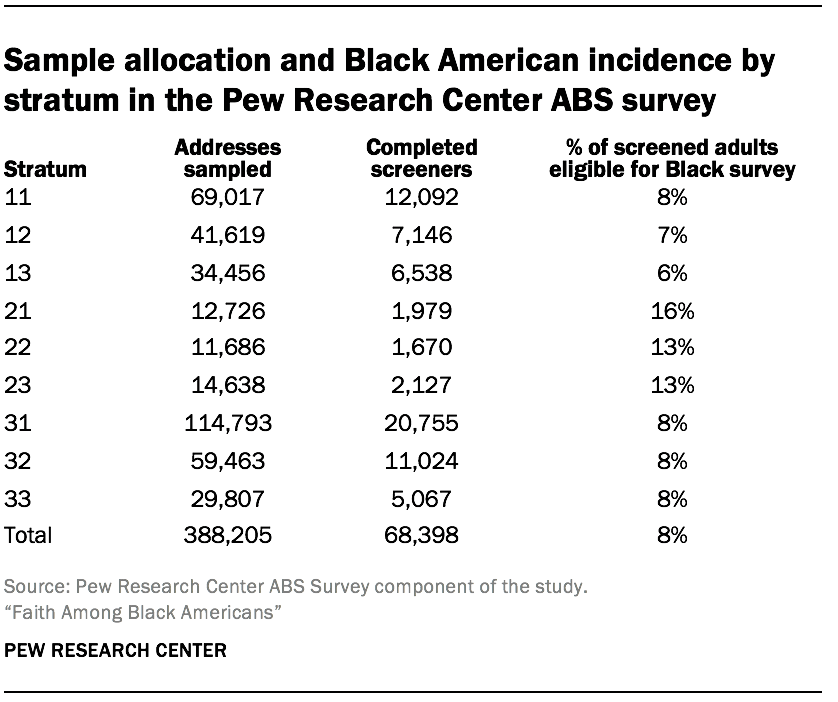
The last step in the stratification divided each stratum into three substrata. For the higher density strata (1, 2), the substratum boundaries were determined using the squared root of the ZCTA-level estimate of the number of Jewish adults. In the lowest density stratum (3), the substratum boundaries were based on the estimated of the number of Jewish adults in the county-group.
Westat divided the sample of drawn addresses into two replicate subsamples. At the beginning of data collection, Westat only mailed to the first replicate of addresses. About two months later, Westat began mailing the second replicate of addresses. This approach allowed researchers to evaluate the performance of the data collection protocol and apply adjustments before the second replicate was fielded. From the first replicate, it was clear that the response rate to the screening interview was lower than projected, and it would result in too few completed interviews with Black and Jewish respondents. To address the shortfall, Westat supplemented the sample with additional addresses and made small changes to the study materials.
One of the changes implemented between replicates was to the procedure used to randomly select one adult from each sample household. In the first replicate each sampled address was randomly assigned to one of four groups referred to as YM, OM, YF, or OF. In group YM, the youngest male adult is sampled (if there are no males, the youngest female is sampled). Group OM samples the oldest male (or oldest female if no males present). YF and OF are the analogous groups for sampling women by age. After the first replicate fell short of yield projections, a simpler selection procedure was used; the adult in the household with the next birthday was instructed to complete the survey. The next-birthday method was also used for the last two screener recruitment mailings for the first replicate.
Once the adult completed the screening interview on the web, the adult was identified as either being eligible for the Black adult survey, for the Jewish adult survey, or neither. Eligible adults identified in the web survey were immediately asked to continue with the extended questionnaire. For households that returned paper screener questionnaires, eligible adults were mailed the appropriate survey paper questionnaires.
Westat’s initial expectation was that the design would yield more than the targeted number of interviews with Black adults. Consequently, the protocol initially subsampled eligible Black adults in each stratum at rates chosen to reduce the design effect. However, once it became apparent that the screener response rate was lower than expected, the subsampling was removed from the protocol and the extended interview was administered to all eligible Black adults. Eligible Black adults who had previously completed the screener but were not selected were recontacted and asked to complete the Black adult survey.
Pretesting
The ATP and KnowledgePanel fielding featured a soft launch with an initial batch of 300 panelists. Pew Research Center and Ipsos staff performed quality checks on the soft launch data, but no changes were made prior to the release of the remaining sample. In the AmeriSpeak sample, a small sample of panelists were invited for a pretest. In total, NORC collected 23 pretest interviews. The initial data from the pretest was reviewed by NORC and delivered to Pew Research Center. Prior to the full survey launch, NORC made small logic changes to two questions as well as minor edits to text. No pretest was conducted for the Pew Research Center ABS survey due to the absence of empaneled adults and constraints in the study schedule.
Data collection
The survey was administered in English and Spanish in all four samples. In the ATP and KnowledgePanel samples, all interviewing was conducted online. Households without home internet at the time of recruitment were provided with devices and data plans to enable online response. In the AmeriSpeak sample, 83% of interviews were conducted online while 17% were conducted using live telephone interviewers. In the Pew Research Center ABS survey, 66% of interviews with Black adults were completed online while 34% were completed via mail.
To encourage study cooperation, Ipsos mailed an advance postcard to all sampled ATP panelists. ATP panelists were invited via email to take the survey, and they were later sent up to four email reminders. For those who have provided express consent to receive SMS messages, Ipsos sent the survey invitation (HTML link) via SMS message and later sent up to four SMS message reminders. ATP respondents received $5 to $20 for their participation, depending on whether they have hard-to-reach characteristics.
For the KnowledgePanel sample, Ipsos sent the survey invitation via email, plus up to four additional email reminders. KnowledgePanel respondents received a post-payment under the incentive structure for their panel.
To encourage cooperation in the AmeriSpeak sample, NORC sent up to five email reminders to sampled web-mode panelists. To administer the phone survey, NORC dialed the sampled phone-mode panelists throughout the field period. In addition, starting on Jan. 24, 2020, a subset of AmeriSpeak web-mode panelists were also called to encourage response. These web panelists could complete the survey via phone if convenient. AmeriSpeak panel respondents received an incentive equivalent to between $5 and $10 in cash, depending on their age and completion date.
For the Pew Research Center ABS survey, the data collection protocol was much more extensive because the respondents did not belong to a survey panel but instead needed to be recruited for the first time. To maximize response, the study used a sequential mode protocol in which sampled households were first directed to respond online and later mailed a paper version of the questionnaire. Moreover, the measurement process featured two stages: a screening questionnaire for all sampled adults followed by an extended questionnaire for those eligible.
The first mailing for the Pew Research Center ABS survey was a letter introducing the study and providing the information necessary (URL and unique PIN) for online response. A pre-incentive of $2 was included. This and remaining screener recruitment letters focused on the screener survey, without mentioning the possibility of eligibility for longer surveys and associated promised incentive, since most people would only be asked to complete the short screening survey.
Next, Westat sent a postcard reminder, followed by a reminder letter to nonrespondents. Westat later sent nonrespondents a paper version screening survey, which was a four-page booklet (one folded 11×17 paper) and a postage-paid return envelope in addition to the cover letter. If no response was obtained from those four mailings, no further contact was made. Black Americans completing the screening survey in either mode received a $10 post-paid incentive for completing the extended survey.
If an eligible respondent completed the screener online but did not complete the extended interview, Westat sent them a reminder letter. This was performed on a rolling basis when it had been at least one week since the web breakoff. Names were not collected until the end of the web survey, so these letters were addressed to “Recent Participant,” but the content of the letter referenced the reported age and sex of the participant when available, so that the same participant would continue the survey.
If an eligible respondent completed a paper screener, Westat mailed them the appropriate extended survey and a postage-paid return envelope. This was sent weekly as completed paper screeners arrived. The paper screeners asked for a “first name or initials in case we have any questions about your survey,” and Westat addressed the extended mailings using this information. The content of the letter also referenced the reported age and sex of the participant when available. Westat followed these paper mailings with a reminder postcard. Later Westat sent a final paper version via FedEx to eligible adults who had not completed the extended interview online or by paper.
Weighting
The data in this study is weighted both to produce accurate estimates for the adult Black population in the U.S. and to allow comparison to the full, U.S. adult population (including both Black and non-Black adults). To do this, data from the four samples was combined into a single dataset and weighted to match the demographic profile of the noninstitutionalized U.S. adult population.
This was done in three stages. First, a sample-specific weight was created for each sample that accounts for each source’s unique design features. Next, the weights associated with each of the four samples were integrated and rescaled to create a harmonized base-weight for the combined sample. Finally, the combined base-weight was calibrated so that the demographic profile of both Black and non-Black respondents aligned with benchmarks from the Census Bureau and other sources.
Sample-specific weights
Sample-specific weights were created separately for each of the three online panels according to each panel’s standard procedure. Although they vary in the particulars, each panel follows a similar process that begins with weights that reflect each panelist’s initial probability of selection into the panel recruitment survey. Then, the entire pool of active panelists is calibrated to U.S. population benchmarks in order to correct for nonresponse to the recruitment survey and panel attrition. The specifics of the calibration targets vary between the three panels. Finally, the weights for those panelists sampled for the particular survey are further adjusted to account for any differential probability of selection between panelists for this particular survey. These weights did not include any additional adjustment for nonresponse because that step is to be performed on the final, combined sample. Additional details about the weighting protocols for the KnowledgePanel, AmeriSpeak and ATP are available.
The sample-specific weight for the ABS sample created by Westat accounted for the complex sample design and nonresponse to the first-stage screening survey. First, each household was weighted inversely proportional to its probability of selection from the ABS frame. This weight was then adjusted to account for the fact that some portion of the nonresponding households would have been ineligible. Next, a household-level nonresponse adjustment was performed by poststratifying the responding households to cells based on the sampling strata and other variables available on the sampling frame.
The household weight was then multiplied by the number of adults in the household (capped at three) to account for the fact that individuals in households with more eligible adults have a lower chance of being selected as the respondent than those in households with fewer adults. This person-level weight was then raked to U.S. adult population benchmarks from the 2014-2018 American Community Survey five-year file, resulting in a general population weight for all adults who completed the screener.
This screener weight, which accounts for differential probabilities of selection and nonresponse to the first-stage screener, was used as the sample-specific weight for the ABS respondents to the survey on religion among Black Americans. A final adjustment was made to the weights for those who had also been eligible the survey of American Jews. For those who were eligible for both surveys, a final adjustment was made to account for the subsampling that allocated 80% of such respondents to the Jewish survey.
Sample integration
To create a single, integrated dataset, the samples were combined, and each respondent was placed into one of three groups based on differences in each sample’s eligibility criteria. The first group consisted of adults who identified as Black (including Black Hispanics and multiracial Black adults). Adults in this category were eligible to participate in all four of the samples. The second group was comprised of respondents who did not identify as Black but did identify as Afro-Latino. Members of this group were only present in the general population ATP sample and the ABS sample for which they had included in the eligibility criteria. There were no such respondents from KnowledgePanel or AmeriSpeak since only panelists who had previously identified as Black were invited to participate. The third group consisted of respondents who were neither Black nor Afro-Latino and consisted entirely of respondents from the ATP.
Within each group, the weights for each sample’s respondents were scaled to sum to their effective sample size. This determined the relative contribution of each sample source within the groups. The final step in integrating the samples and their associated weights involved rescaling the combined weights for each category proportional to its share of the full U.S. adult population. Because there is no official benchmark, the size of the Afro-Latino population was estimated from the weighted distribution on the Pew Research Center ABS survey screener.
Calibration to benchmarks
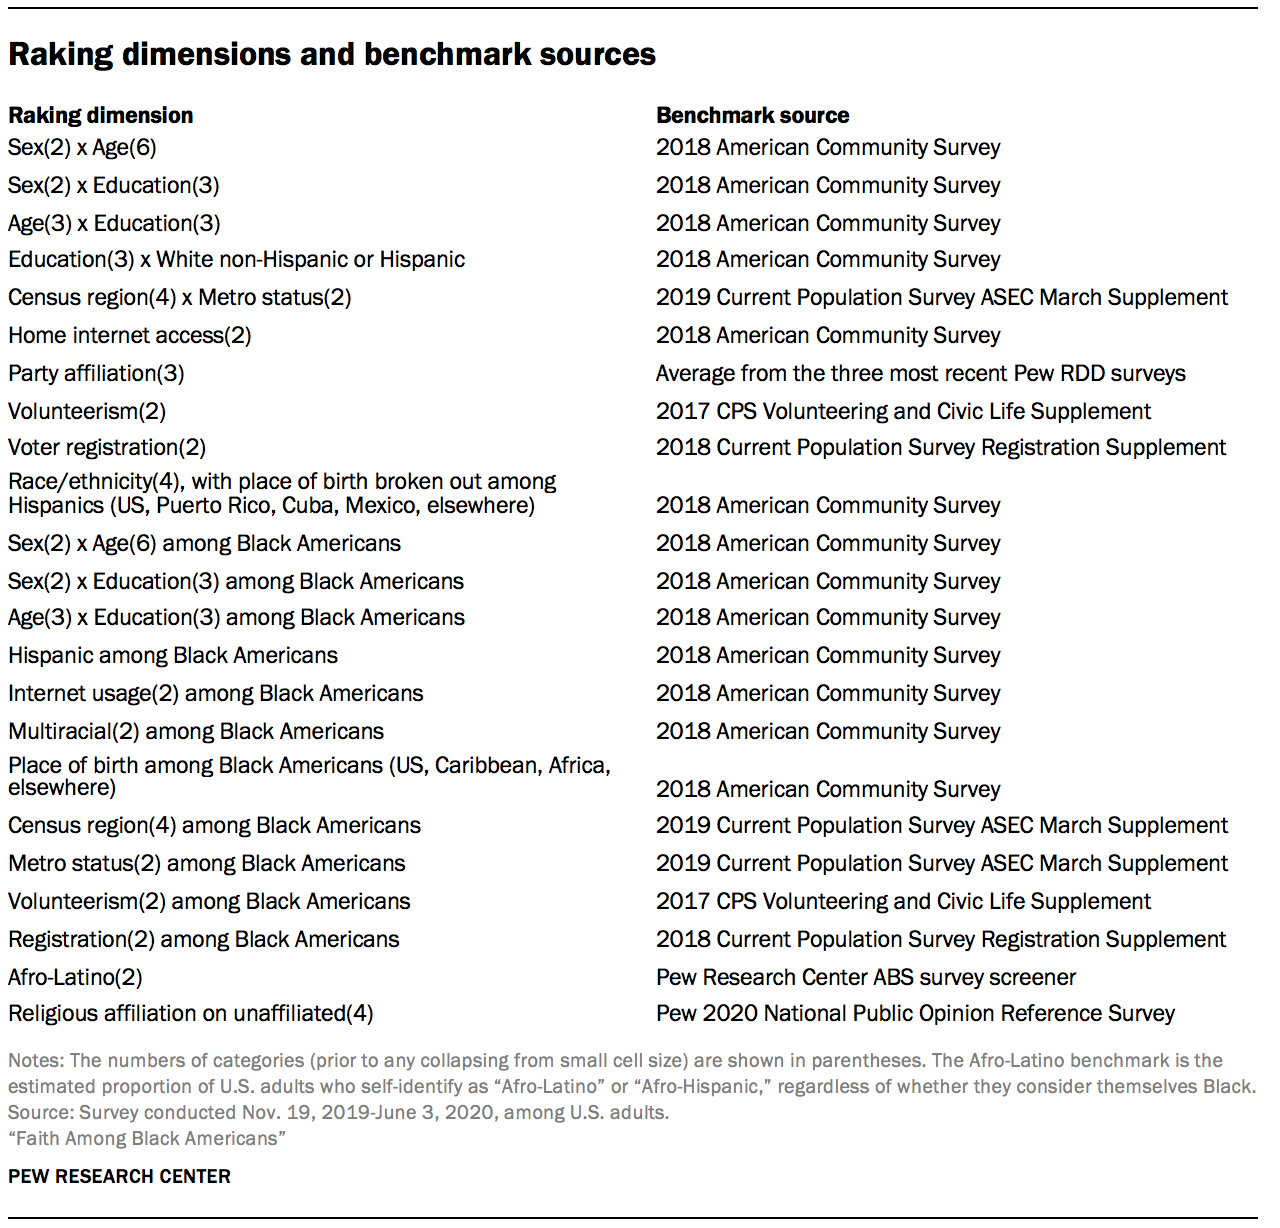
Using this harmonized base weight, researchers raked the sample to the population benchmark targets listed in the table below. This raked weight was trimmed at the 5th and 95th percentiles to reduce the loss of precision stemming from variance in the weights.
Response rates
Overall response rate
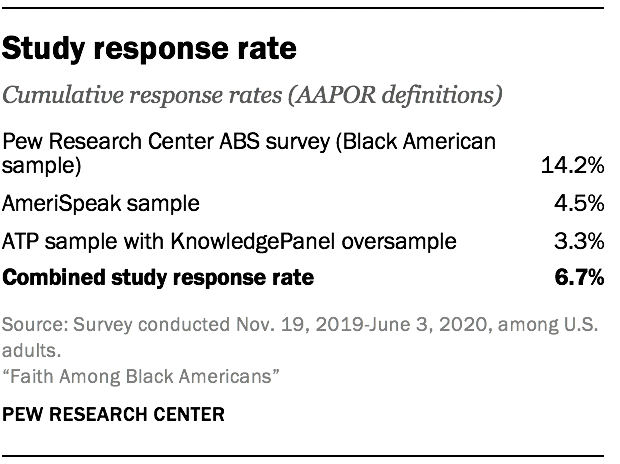
This study features several different samples, which complicates the computation of an overall response rate. Following AAPOR Standard Definitions, researchers computed the overall response rate for this study in several steps: (1) compute the proportion of the total number of completed interviews coming from each sample, (2) for each sample, multiply that proportion by the cumulative response rate, (3) sum the factors from the previous step.55 The overall response rate for this study was 6.7%.
Response rates for each sample
Everyone selected in the online panel samples was eligible for the survey, and the survey-level response rates report what share of them completed the survey. In the ATP, a total of 8,057 panelists responded out of 12,442 who were sampled, for a survey-level response rate of 65%. This includes 5,499 from the ATP and an oversample of 2,558 Black respondents sampled from the Ipsos KnowledgePanel. This does not include four panelists who were removed from the data due to extremely high rates of refusal or straight-lining. The cumulative response rate accounting for nonresponse to the recruitment surveys and attrition is 3.3%. The break-off rate among panelists who logged onto the survey and completed at least one item is 2.7%. For the AmeriSpeak sample, the survey-level response rate was 22%. The weighted AAPOR 3 response rate to the recruitment is 24%, and the weighted household panel retention rate is 86%, yielding a weighted cumulative response rate of 4.5%.
A fulsome accounting of the Pew Research Center ABS survey requires more information because respondents were being recruited for the first time. Westat assigned all sampled cases a result code for their participation in the screener, and then they assigned a result for the extended Black American questionnaire for those who were eligible. Two of the dispositions warrant some discussion. One is the category “4.313 No such address.” This category is for addresses that were returned by the postal service as not being deliverable. This status indicates the address, which was on the USPS Delivery Sequence file at the time of sampling, currently is not occupied or no longer exists. The second category is “4.90 Other.” This category contains 1,231 addresses that were never mailed because they were for addresses that had a drop count of greater than four. Drop points are addresses with multiple households that share the same address. The information available in the ABS frame on drop points is limited to the number of drop points at the address, without information on the type of households at the drop point, or how they should be labeled for mailing purposes. In the Pew Research Center ABS survey, all drop points were eligible for sampling, but only those with drop point counts of 4 or less were mailed. Westat treated drop point counts of five or more as out of scope, and no mailing was done for those addresses.
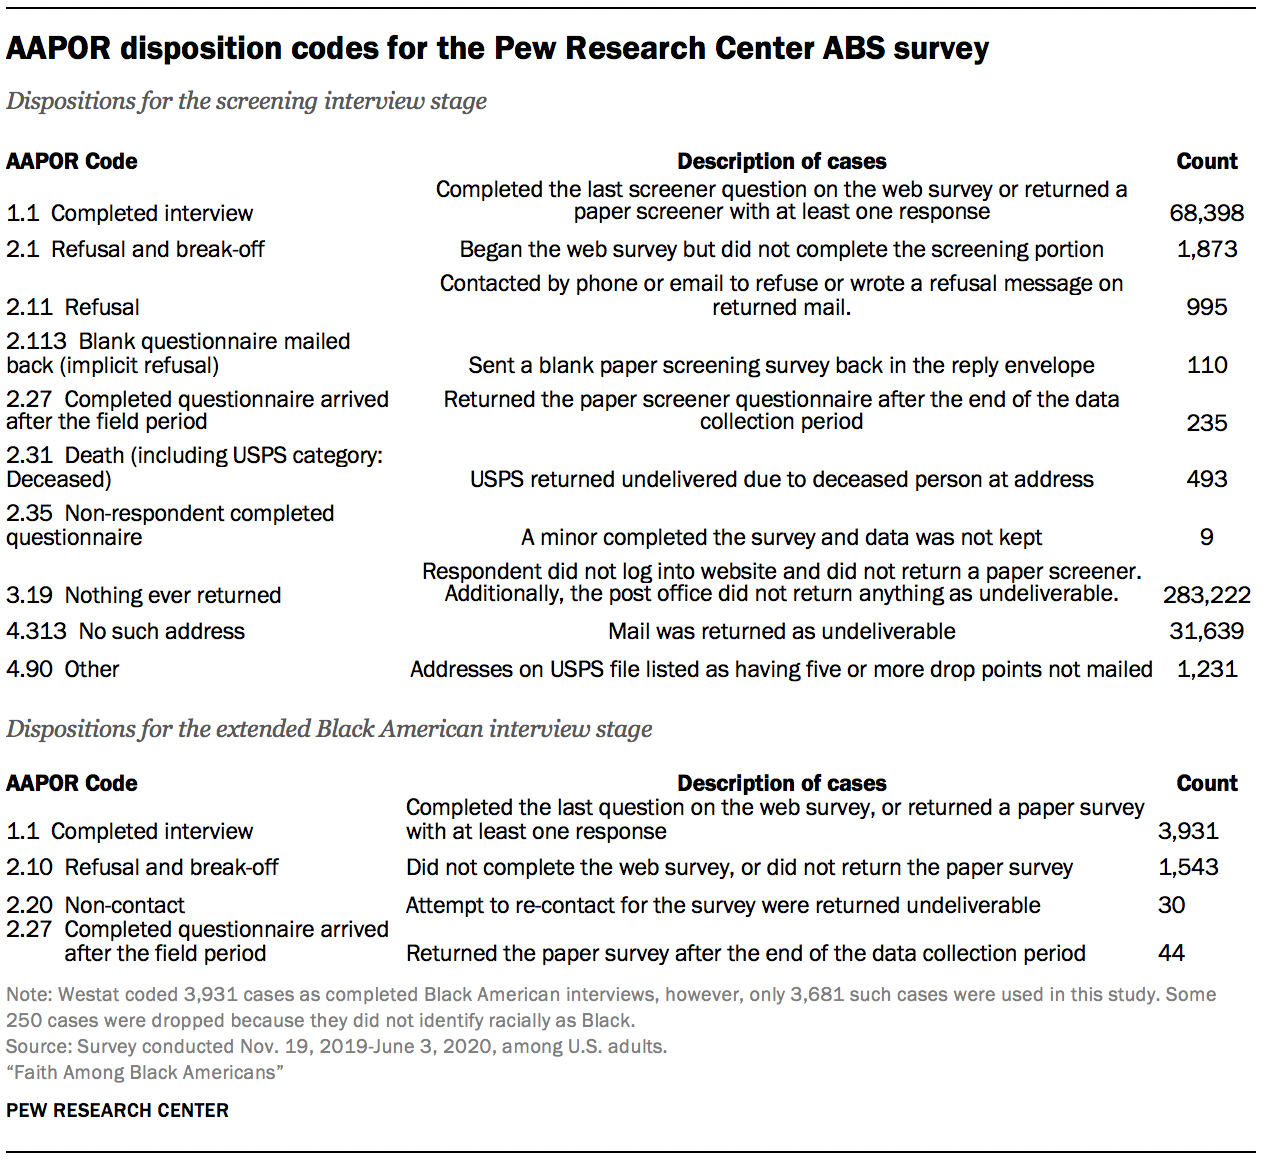
Westat used the disposition results to compute response rates consistent with AAPOR definitions. The response rates are weighted to account for the differential sampling in this survey. The weight is the inverse of the probability of selecting the address.56 The response rate to the Pew Research Center ABS survey screening interview was 20.1%.57 The response rate to the extended Black American interview, 70.9%, is the number of Black adults completing the questionnaire over the total sampled for that extended questionnaire. The overall response rate is the product of the screener response rate and the conditional response rate for the extended questionnaire. The overall response rate for the Black American sample in the Pew Research Center ABS survey was 14.2% (20.1% x 70.9%).
Acknowledgments
Many individuals contributed to the data collection for this study. In particular, Pew Research Center is grateful to Wendy Mansfield, Mike Picco, and Karen Melia from Ipsos; Hanna Popick, Eric Jodts, Mike Brick, and Ismael Flores Cervantes from Westat; and Katie Simmons from NORC.


