American Trends Panel survey methodology
Overview
The American Trends Panel (ATP), created by Pew Research Center, is a nationally representative panel of randomly selected U.S. adults. Panelists participate via self-administered web surveys. Panelists who do not have internet access at home are provided with a tablet and wireless internet connection. Interviews are conducted in both English and Spanish. The panel is being managed by Ipsos.
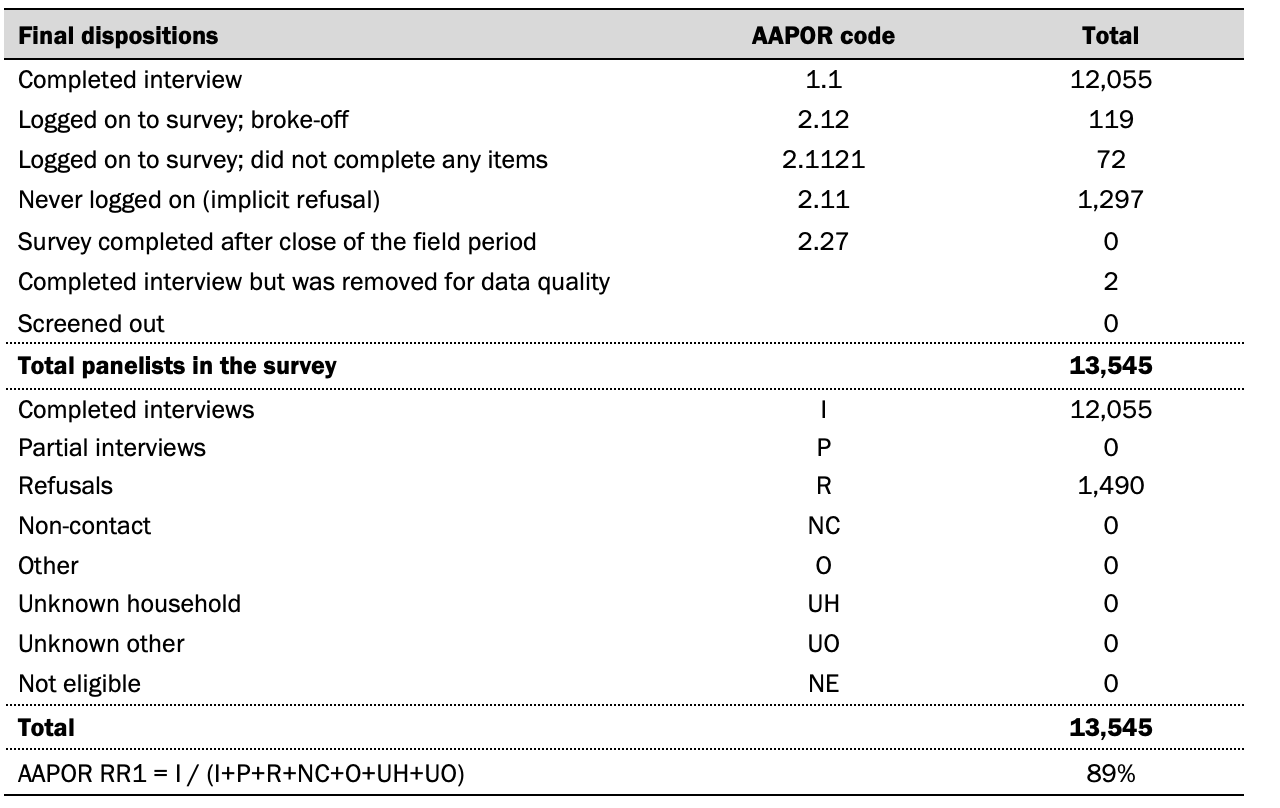
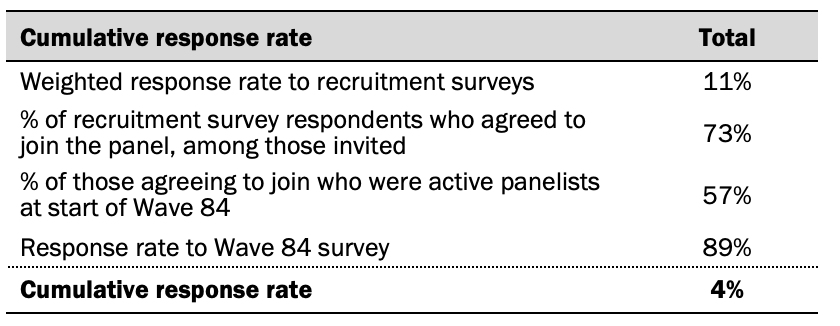
Data in this report is drawn primarily from the panel wave conducted March 1 to March 7, 2021. A total of 12,055 panelists responded out of 13,545 who were sampled, for a response rate of 89%. This does not include two panelists who were removed from the data due to extremely high rates of refusal or straightlining. The cumulative response rate accounting for nonresponse to the recruitment surveys and attrition is 4%. The break-off rate among panelists who logged on to the survey and completed at least one item is 1%. The margin of sampling error for the full sample of 12,055 respondents is plus or minus 1.5 percentage points.
Panel recruitment
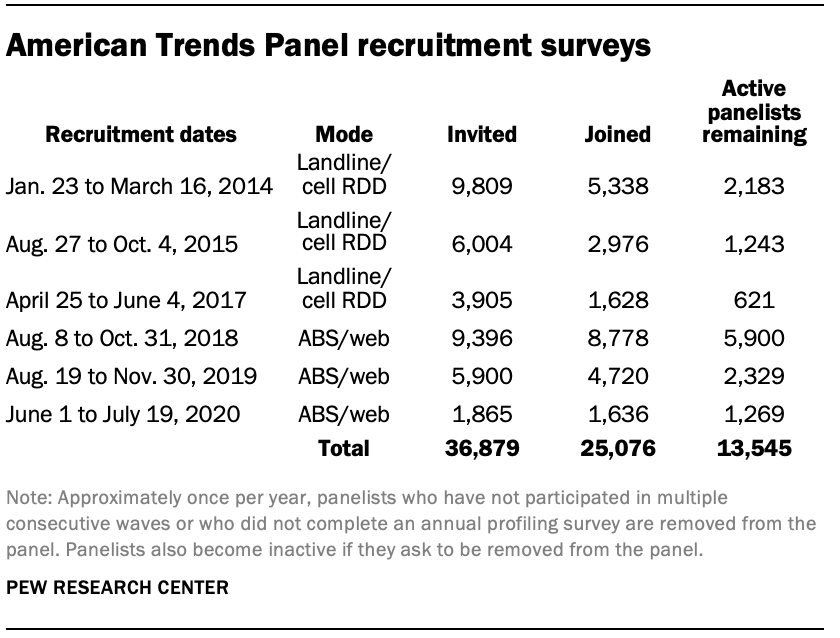
The ATP was created in 2014, with the first cohort of panelists invited to join the panel at the end of a large, national, landline and cellphone random-digit-dial survey that was conducted in both English and Spanish. Two additional recruitments were conducted using the same method in 2015 and 2017, respectively. Across these three surveys, a total of 19,718 adults were invited to join the ATP, of whom 9,942 (50%) agreed to participate.
In August 2018, the ATP switched from telephone to address-based recruitment. Invitations were sent to a random, address-based sample of households selected from the U.S. Postal Service’s Delivery Sequence File. Additional recruitments were conducted using the same method, once in 2019 and then again in 2020. Across these three address-based recruitments, a total of 17,161 adults were invited to join the ATP, of whom 15,134 (88%) agreed to join the panel and completed an initial profile survey. In each household, the adult with the next birthday was asked to go online to complete a survey, at the end of which they were invited to join the panel. Of the 25,076 individuals who have ever joined the ATP, 13,545 remained active panelists and continued to receive survey invitations at the time this survey was conducted.
The U.S. Postal Service’s Delivery Sequence File has been estimated to cover as much as 98% of the population, although some studies suggest that the coverage could be in the low 90% range.3 The American Trends Panel never uses breakout routers or chains that direct respondents to additional surveys.
Sample design
The overall target population for this survey was non-institutionalized persons ages 18 and older, living in the U.S., including Alaska and Hawaii.
Questionnaire development and testing
The questionnaire was developed by Pew Research Center in consultation with Ipsos. The web program was rigorously tested on both PC and mobile devices by the Ipsos project management team and Pew Research Center researchers. The Ipsos project management team also populated test data which was analyzed in SPSS to ensure the logic and randomizations were working as intended before launching the survey.
Incentives
All respondents were offered a post-paid incentive for their participation. Respondents could choose to receive the post-paid incentive in the form of a check or a gift code to Amazon.com or could choose to decline the incentive. Incentive amounts ranged from $5 to $20 depending on whether the respondent belongs to a part of the population that is harder or easier to reach. Differential incentive amounts were designed to increase panel survey participation among groups that traditionally have low survey response propensities.
Data collection protocol
The data collection field period for this survey was March 1 to March 7, 2021. Postcard notifications were mailed to all ATP panelists with a known residential address on March 1, 2021.
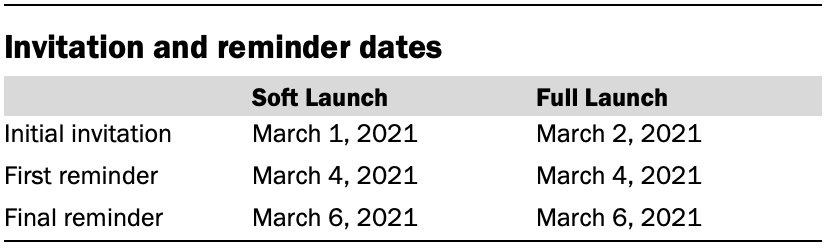
On March 1 and March 2, invitations were sent out in two separate launches: Soft Launch and Full Launch. Sixty panelists were included in the soft launch, which began with an initial invitation sent on March 1, 2021. The ATP panelists chosen for the initial soft launch were known responders who had completed previous ATP surveys within one day of receiving their invitation. All remaining English- and Spanish-speaking panelists were included in the full launch and were sent an invitation on March 2, 2021.
All panelists with an email address received an email invitation and up to two email reminders if they did not respond to the survey. All ATP panelists that consented to SMS messages received an SMS invitation and up to two SMS reminders.
Data quality checks
To ensure high-quality data, the Center’s researchers performed data quality checks to identify any respondents showing clear patterns of satisficing. This includes checking for very high rates of leaving questions blank, as well as always selecting the first or last answer presented. As a result of this checking, two ATP respondents were removed from the survey dataset prior to weighting and analysis.
Weighting
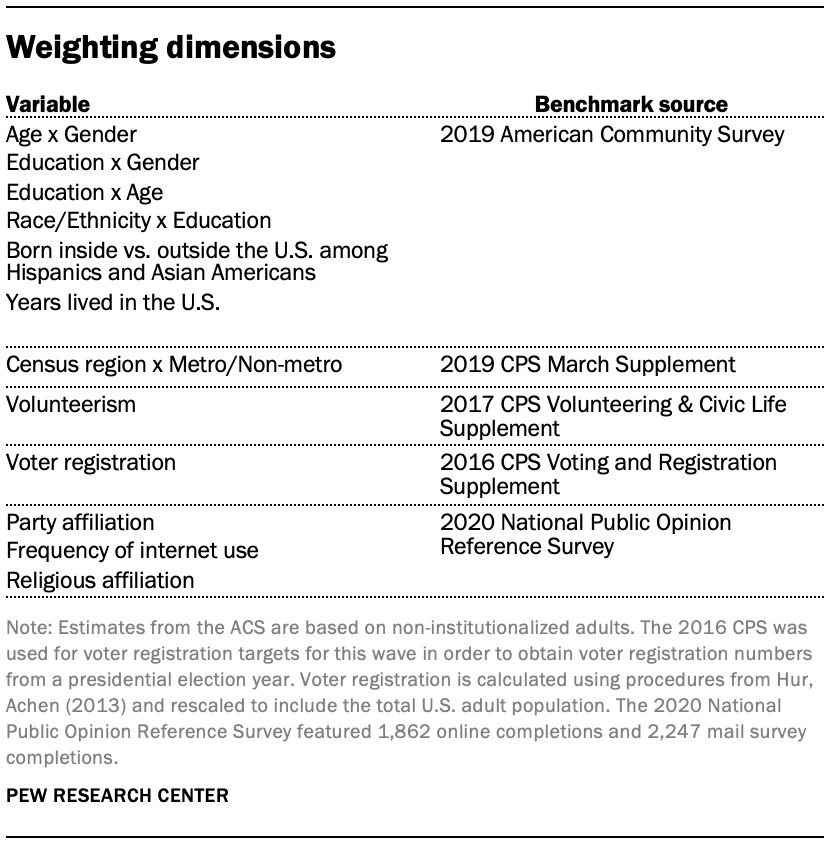
The ATP data was weighted in a multistep process that accounts for multiple stages of sampling and nonresponse that occur at different points in the survey process. First, each panelist begins with a base weight that reflects their probability of selection for their initial recruitment survey (and the probability of being invited to participate in the panel in cases where only a subsample of respondents were invited). The base weights for panelists recruited in different years are scaled to be proportionate to the effective sample size for all active panelists in their cohort. To correct for nonresponse to the initial recruitment surveys and gradual panel attrition, the base weights for all active panelists are calibrated to align with the population benchmarks identified in the accompanying table to create a full-panel weight.
For ATP waves in which only a subsample of panelists are invited to participate, a wave-specific base weight is created by adjusting the full-panel weights for subsampled panelists to account for any differential probabilities of selection for the particular panel wave. For waves in which all active panelists are invited to participate, the wave-specific base weight is identical to the full-panel weight.
In the final weighting step, the wave-specific base weights for panelists who completed the survey are again calibrated to match the population benchmarks specified above. These weights are trimmed (typically at about the 1st and 99th percentiles) to reduce the loss in precision stemming from variance in the weights. Sampling errors and tests of statistical significance take into account the effect of weighting.
Some analysis in this report is based on questions that were asked on previous ATP waves conducted on Sept. 3-15, 2019, and July 27-Aug. 2, 2020. In these instances, data for the respondents who participated in both waves was weighted following the same procedure as for the full sample. Methodologies for those waves can be found here and here.
Creation of the church-state views scale
The scale reflects responses to six survey questions. In each question, respondents were presented with two contrasting statements, and asked which most closely reflects their own view. Respondents were also given the option of choosing “neither/no opinion.” The pairs of statements are:
Cities and towns in the U.S. should be allowed to place religious symbols on public property OR Cities and towns in the U.S. should keep religious symbols off public property
Teachers in public schools should be allowed to lead students in Christian prayers OR Teachers in public schools should not be allowed to lead students in any kind of prayers
The federal government should stop enforcing separation of church and state OR The federal government should enforce separation of church and state
The U.S. Constitution was inspired by God and reflects God’s vision for America OR The U.S. Constitution was written by human beings and reflects their vision for America, not necessarily God’s vision
The federal government should declare the United States a Christian nation OR The federal government should never declare any particular religion as the official religion of the United States
The federal government should advocate Christian religious values OR The federal government should advocate for moral values that are shared by people of many faiths
Before creating the scale, researchers confirmed that the six survey questions described here do, in fact, scale well together (i.e., are highly correlated with each other). Each question was coded from 0 to 2, with 0 points assigned for the church-state separationist response (e.g., “Cities and towns in the U.S. should keep religious symbols off public property” or “The federal government should enforce separation of church and state”), 1 point assigned for “neither/no opinion” responses as well as for those who refused to answer the question, and 2 points assigned for church-state integrationist responses (e.g., “Cities and towns in the U.S. should be allowed to place religious symbols on public property” or “The federal government should stop enforcing separation of church and state”). Cronbach’s alpha for a scale consisting of items coded in this way is 0.76.
To sort respondents into categories, researchers began by putting everyone who said “neither/no opinion/refused” to four or more of the six items into a “no opinion” category. They did not provide enough information to classify their views about church-state issues. Overall, 12% of respondents express “no opinion” on the scale.
Next, the remaining 88% of respondents were sorted into three categories – “church-state integrationists,” “church-state separationists,” and “mixed.” Respondents who offered four or more church-state integrationist answers in response to the six questions were placed in the “church-state integrationist” category. Respondents who offered four or more church-state separationist answers were placed in the “church-state separationist” category.
What about respondents who offered three church-state integrationist answers or three church-state separationist answers? They were sorted based on the number of opposing responses they gave. If respondents gave three church-state integrationist answers and only one or zero church-state separationist answers, then they were placed in the “church-state integrationist” category along with those who gave four or more church-state integrationist answers. However, respondents who gave three church-state integrationist answers and also gave a similar number (i.e., two or three) church-state separationist answers were placed in the mixed category, reflecting their mixed views on these matters. Similarly, respondents who gave three church-state separationist answers were placed in the “church-state separationist” category if they only gave zero or one church-state integrationist answers, but in the mixed category if they also gave two or three church-state integrationist answers.
The remaining respondents – those who gave two of one kind of answer and one or two answers of the opposing kind (with the balance of responses consisting of “neither/no opinion” or refusals) – were placed in the mixed category.
The scale created this way categorizes 14% of U.S. adults as church-state integrationists, 18% as having mixed views on these matters, and 55% as church-state separationists. Because the latter group is so large, it is sometimes divided in this report into two groups. “Strong” church-state separationists are those who give five or six church-state separationist responses and zero church-state integrationist responses; 28% of U.S. adults are “strong” church-state separationists. All other respondents from the larger “church-state separationist” category (27% of U.S. adults) can be considered “moderate” church-state separationists. The church-state integrationist category is too small to similarly analyze “strong” and “moderate” categories.
Sample sizes and margins of error
The following tables show the unweighted sample sizes and the error attributable to sampling that would be expected at the 95% level of confidence for different groups analyzed in this report.
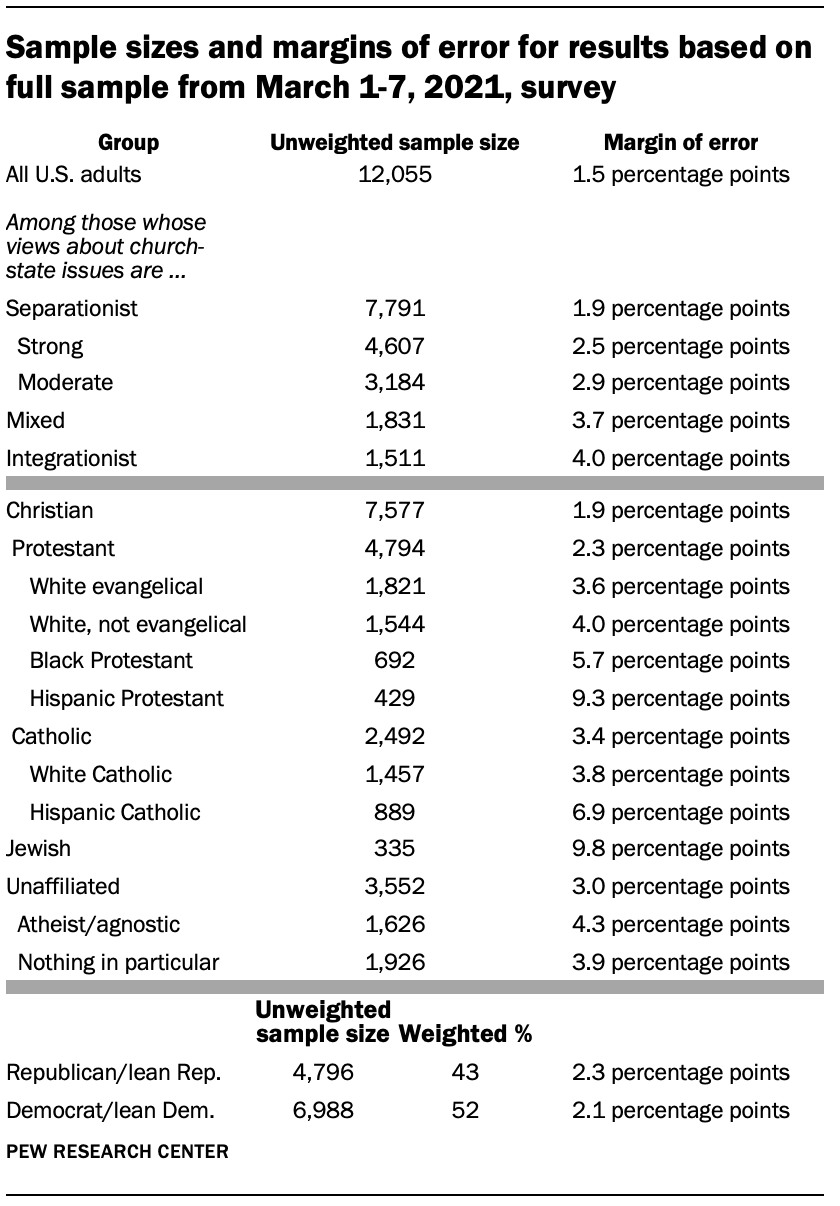
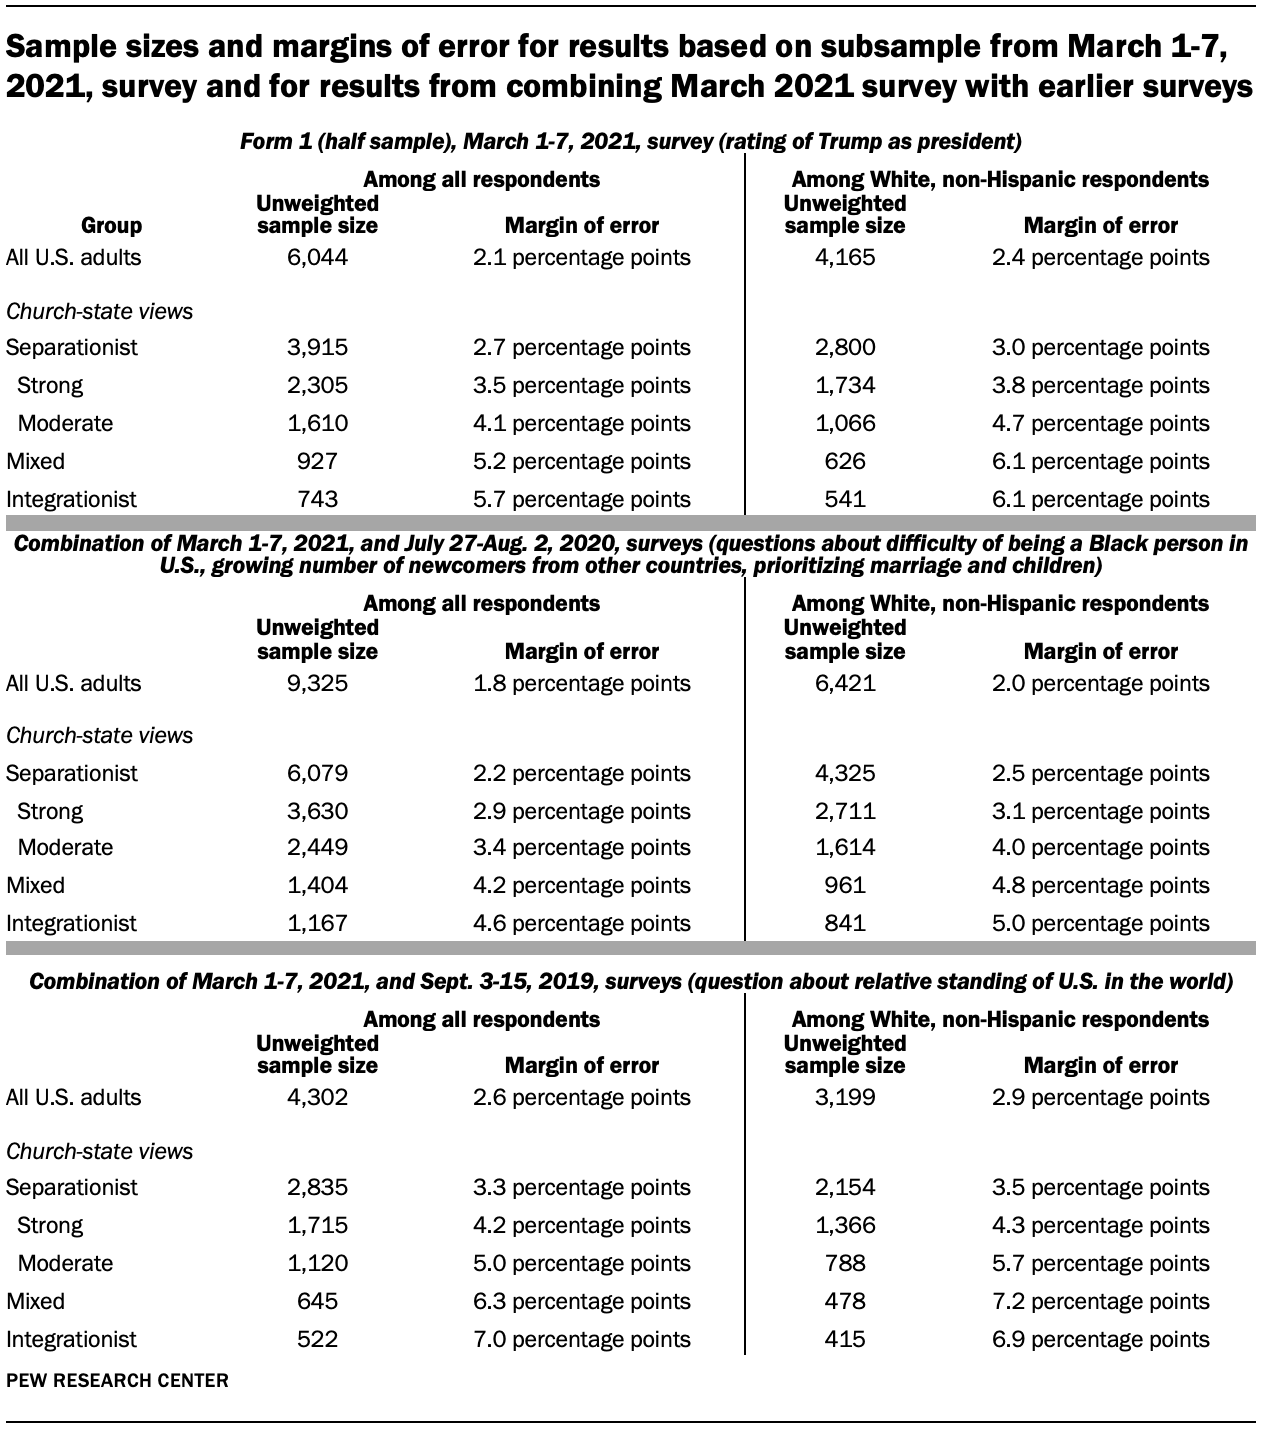
Sample sizes and sampling errors for other subgroups are available upon request. In addition to sampling error, one should bear in mind that question wording and practical difficulties in conducting surveys can introduce error or bias into the findings of opinion polls.
Dispositions and response rates (for March 1-7, 2021, survey)
© Pew Research Center, 2021


