This Pew Research Center analysis on views of how to improve democracy uses data from nationally representative surveys conducted in 24 countries.
For non-U.S. data, this analysis draws on nationally representative surveys of 27,285 adults conducted from Feb. 20 to May 22, 2023. Surveys were conducted over the phone with adults in Canada, France, Germany, Greece, Italy, Japan, the Netherlands, South Korea, Spain, Sweden and the United Kingdom. They were conducted face-to-face with adults in Argentina, Brazil, Hungary, India, Indonesia, Israel, Kenya, Mexico, Nigeria, Poland and South Africa. In Australia, we used a mixed-mode probability-based online panel. All responses are weighted to be representative of the adult population in each country. Read more about international survey methodology.
In the U.S., we surveyed 3,576 adults from March 20 to March 26, 2023. Everyone who took part in this survey is a member of the Center’s American Trends Panel (ATP), an online survey panel that is recruited through national, random sampling of residential addresses. This way, nearly all U.S. adults have a chance of selection. The survey is weighted to be representative of the U.S. adult population by gender, race, ethnicity, partisan affiliation, education and other categories. Read more about the ATP’s methodology.
Respondents in all countries were asked the following question: “We’d like to know more about your views of democracy in (survey country). What do you think would help improve the way democracy in (survey country) is working?” For interviewer-administered surveys, responses were transcribed by interviewers in the language in which the interviews were conducted. In the sections that follow, we detail how we coded these responses to use for analysis, as well as properties of the responses.
Codebook development
To develop a codebook for the main ways people want to improve their democracy across the 24 countries surveyed, Center researchers iteratively reviewed random samples of native English responses and non-English responses translated by Google Translate and by a professional translation firm. Researchers mapped out the key concepts that commonly appeared in the responses using open coding. After developing an initial set of categories, researchers tested the codebook on multiple random samples of at least 75 native English responses to evaluate the codebook’s conceptual validity. After each round, they reviewed disagreements and refined the codebook before testing it again on another sample.
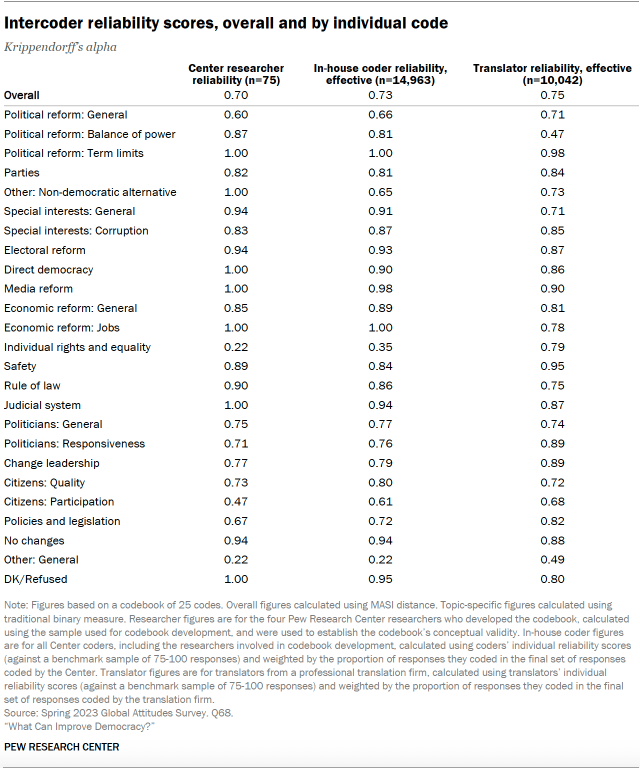
After five iterations of this process, researchers were able to determine that the codebook was clear enough for other coders to independently apply it in a consistent manner. The codebook’s overall Krippendorff’s alpha, measured using MASI distance as a similarity measure, was 0.70 across the 25 codes in the codebook. Krippendorff’s alpha, measured traditionally using a binary measure, was also above 0.70 for most individual codes.
Coding responses
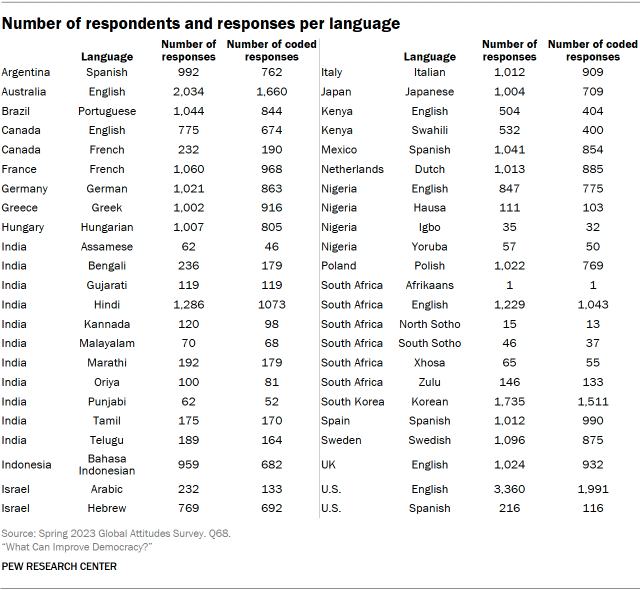
Using these intercoder reliability scores measured during codebook development as a benchmark of acceptable performance, researchers trained a larger group of Center coders and professional translators to apply the codebook at scale to the full set of responses. The full set did not include responses marked as a nonresponse by interviewers, which automatically received a code of “Don’t know/Refused.” In total, 25,005 responses in 36 different languages, including English, from 24 different countries were coded. (For more on nonresponse, go to Characteristics of the responses.)
Professional translators as coders
To code the 17,526 non-English responses that were collected in 35 different languages, the Center partnered with a professional translation firm – cApStAn – and utilized Google Translate for select languages. (We have previously experimented with using Google Translate for open-ended survey responses.)
For low-incidence languages, professional translators from cApStAn, hereinafter referred to as “translators,” converted all responses into English, and the translated responses were processed by in-house coders. For all other languages, translators coded and translated to English a random sample of 100 responses from each language after reviewing the codebook. The translators also recorded any questions and comments they had during the coding process. The sampled responses were concurrently translated to English using Google Translate and processed by in-house coders. To evaluate intercoder reliability, the translated responses were divided up and coded by Center researchers who developed the codebook.
After coding the English translations provided by the translators, Center researchers reviewed the translators’ notes and corresponding disagreements, and further refined the codebook with clarifying guidelines and decision-making rules. Center researchers also looked for possible systematic misunderstandings of the codebook within each language-country subset in the sample. For each subset (e.g., Spanish in Argentina), the Center identified disagreements and developed further guidelines to help resolve misunderstandings.
Based on the coding results from the translators and Google Translate, and in conjunction with results of prior analysis, Center researchers determined that Japanese responses could be coded in-house. Researchers also chose to code Spanish responses in-house based on the above results and the staff’s language abilities.
For all other non-English languages, barring low-incidence languages translators were used as coders, following repeated sets of coding and feedback to ensure all of them achieved an acceptable enough understanding of the codebook that they could apply it independently (Krippendorff’s alpha of 0.7 or higher).
Before the translators independently coded the remaining non-English responses, Center researchers provided a final round of extensive feedback. As the translators further improved their understanding of the codebook using this feedback, it is likely that the intercoder reliability scores reported below represent a lower-bound estimate of their actual coding performance on the remaining non-English responses.
English responses coded in-house
To code the responses that were collected natively in English from seven different countries and not already coded in the prior samples described above, Center researchers trained 13 additional in-house coders to apply the codebook independently. Each coder was given a sample of 100 English responses and evaluated for intercoder reliability. The sample was drawn from responses that the original researchers involved in the codebook’s development had reached a consensus for during the codebook development process.
The additional coders were then evaluated against the coding results from Center researchers and given feedback, including notes on the cases where they disagreed with the baseline. Those whose overall MASI-distance Krippendorff’s alpha was at or above 0.70 began independently coding the full queue of native English responses. Those below 0.70 were given additional random responses until they could apply the codebook independently.
The researchers and additional coders from the Center each coded between 65 and 2,677 responses. Weighted proportionally by their contribution to the total number of responses, these in-house coders achieved an overall effective intercoder reliability MASI-distance Krippendorff’s alpha of 0.73. Their collective reliability (measured by standard binary Krippendorff’s alphas) was also at or above 0.70 for most codes independently.
Collapsing codes for analysis
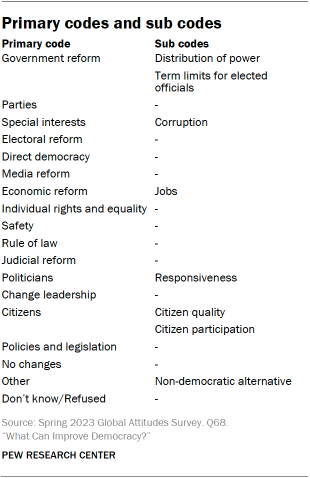
The original codebook for this analysis contains 25 unique codes applied to each unit of information in responses. Center researchers recategorized these 25 codes into 18 “primary” codes – including 17 substantive primary codes and one primary code for nonresponse – and eight “sub” codes to focus on overall themes throughout the text. For example, the “economic reform” code contains not only general mentions of changes to the economic system, but also any mentions of “jobs.”
Characteristics of the responses
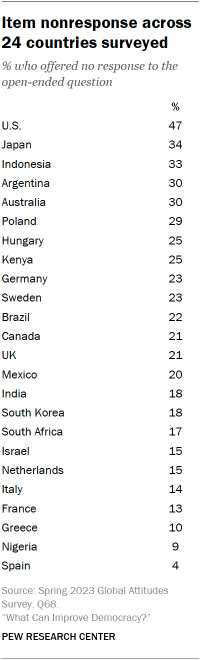
Item nonresponse varies significantly across the 24 countries included in the survey. In Spain, just 4% did not provide an answer to the open-ended question, while 47% did not respond in the U.S. Roughly a third of respondents did not answer the question in Argentina, Australia, Indonesia and Japan.
Previous research has established that item nonresponse is higher for open-ended questions than for closed-ended questions, which have a pre-fixed set of response options. Factors like the level of cognitive burden for the respondent and whether the topical focus is political can also contribute. The difficulty of this open-ended question as well as its political nature likely contributed to higher nonresponse rates.
People with lower levels of formal education were more likely not to answer the question in most countries surveyed, as were younger adults relative to older adults in some countries.
Countries also vary in how much detail the average respondent provided. For example, Spanish responses in Spain averaged 32 words, more than double the 14 words in the average Spanish response in Mexico. While this particular gap may be attributable to mode differences – responses in Spain were collected over the phone, while responses in Mexico were collected in person – response length also varies between the publics that were surveyed in person. In Argentina, where the survey was also administered in Spanish and face-to-face, people provided an average of nine words.
Whether due to mode or to cultural, demographic or other factors, variation in response length ultimately manifests as variation in the number of topics mentioned in a given response. For example, across the 24 countries surveyed, a median of 73% mentioned only one topic in our codebook (e.g., politicians). The share in South Korea is much higher, with 92% suggesting only one area of improvement when describing what they think would improve democracy. In comparison, about a quarter or more mention two areas of improvement in France, Spain, Sweden and the U.S.
These differences help explain why the share giving a particular answer in certain publics may appear much lower than others, even if it is the top-ranked suggestion for improving democracy. To give a specific example, 10% of respondents in Poland mention politicians, while 18% do so in South Africa – yet the topic is ranked second in Poland and third in South Africa. Given this discrepancy, researchers have chosen to highlight not only the share of the public that mentions a given topic but also its relative ranking among all topics coded, both in text and in graphics.
Selection of quotes
Open-ended responses included in the report and in the interactive quote sorter have been edited for clarity (and, in some cases, translated into English by a professional firm). They have been purposefully – not randomly – selected to illustrate key points, and selected responses may not be representative of all responses for a given public. Quotes may also have been shortened in the report for brevity. Our analysis is not a fact check of participants’ views.


