The 2014 U.S. Religious Landscape Study is based on telephone interviews with more than 35,000 Americans from all 50 states. This is the second time the Pew Research Center has conducted a Religious Landscape Study. The first was conducted in 2007, also with a telephone survey of more than 35,000 Americans. The results from the new Landscape Study will be published in a series of reports.
Report and Interactive Tool
This interactive tool complements the first and second releases; the first report focuses on the changing religious composition of the U.S. and the demographic characteristics of U.S. religious groups, while the second report looks at religious beliefs and practices as well as social and political views for the U.S. adult population overall and for specific religious traditions. For example, users can:

View the size of the different religious groups in the country, including smaller groups that account for just 1-2% of the population. See the religious composition of the U.S. >
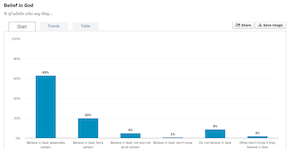
Explore religious beliefs and practices on a variety of measures, such as belief in God and rates of religious service attendance, for all Americans and for members of particular religious groups and denominations. See an example >
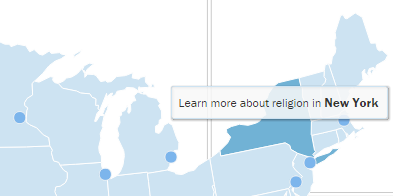
See the percentage of each state’s population that is affiliated with various religious groups, as well as similar data for the country’s largest metropolitan areas. See an example >
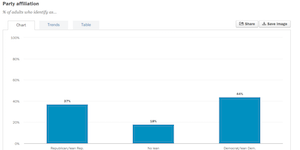
Find out what Americans and members of specific religious groups say about a range of social and political issues, from identification with political parties and ideologies to views about homosexuality, abortion and evolution. See an example >
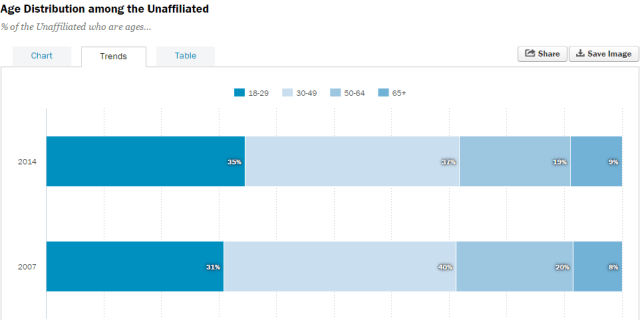
Track changes between 2007 and 2014 among religious groups, geographic areas and demographic groups. See an example >
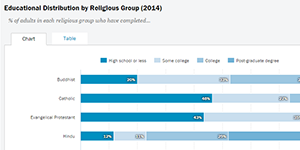
Choose a religious group in the U.S. and compare its demographic characteristics to those of other religious traditions. See an example >
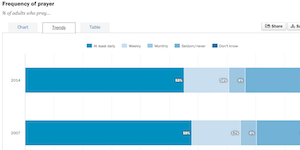
For most of this data, track changes between 2007 and 2014. For instance, see how Americans’ prayer habits have changed over this seven-year period. See an example >
Data Details
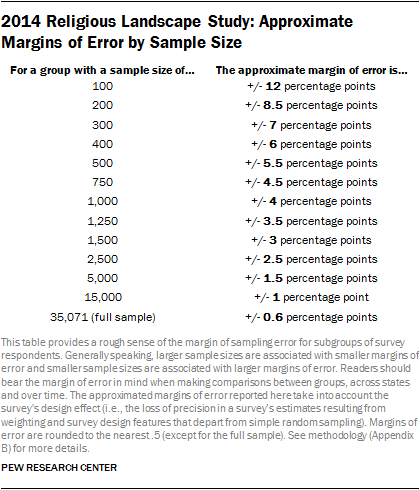
Both the 2007 and 2014 studies have margins of error of less than one percentage point for the full sample, making it possible to identify even relatively small changes in religious groups’ share of the U.S. population. But it is important to keep in mind that larger margins of error apply when looking at the characteristics of smaller groups. The accompanying table shows approximate margins of error for groups of different sizes. This interactive tool does not display results in cases where sample sizes fall below 100 respondents.
In this interactive tool, national religious composition percentages are rounded to the nearest tenth (e.g., 22.8%). For these figures, anything under 0.25% displays as <0.3%. All other percentages (such as state-level data or data on specific demographic groups) are rounded to the nearest integer (e.g., 23%). In these cases, anything less than 0.5% displays as <1%.
For full question wording, see the topline questionnaire.
The Religious Landscape Study was made possible by The Pew Charitable Trusts, which received generous support for the project from Lilly Endowment Inc.
We welcome your feedback and suggestions. Please e-mail us.