Most of the Founding Fathers of the United States – not to mention a majority of U.S. presidents – were members of Christian denominations that fall into the mainline Protestant tradition. But in recent years, the share of Americans who identify with mainline Protestantism has been shrinking significantly, a trend driven partly by generational change.
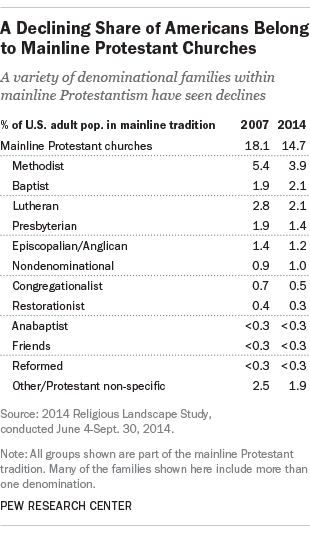
Pew Research Center’s 2014 Religious Landscape Study finds that 14.7% of U.S. adults are affiliated with the mainline Protestant tradition – a sharp decline from 18.1% when our last Religious Landscape Study was conducted in 2007. Mainline Protestants have declined at a faster rate than any other major Christian group, including Catholics and evangelical Protestants, and as a result also are shrinking as a share of all Protestants and Christians.
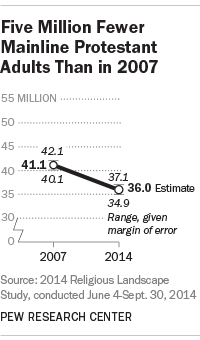
Indeed, despite overall U.S. population growth between 2007 and 2014, the total number of mainline Protestant adults has decreased by roughly 5 million during that time (from about 41 million in 2007 to 36 million in 2014).
Generational replacement appears to be playing a significant role. Older generations have larger shares of mainline Protestants, including 26% of members of the Greatest generation (those born before 1928) and 22% of members of the Silent generation (those born 1928-1945). Mainline Protestant adults in the U.S. have a median age of 52, higher than the group’s median age in 2007 (50) and older than any other major religious tradition.
While older generations die out, the young Americans rising into adulthood are significantly less likely to identify with mainline denominations. Among Millennial adults (born since 1981), 11% are mainline Protestants. By contrast, 16% of Millennials are Catholics, 21% are evangelical Protestants and 35% are religiously unaffiliated.
Additionally, more Americans have been leaving mainline Protestantism than joining the tradition. Nearly one-in-five Americans (19%) were raised in the mainline tradition, but more than half of them (10.4% of all U.S. adults) have left the faith. Meanwhile, 6.1% of Americans have become mainline Protestants after being raised in another tradition. As a result, for every convert to mainline Protestantism, about 1.7 people have left the mainline tradition behind.
Mainline Protestants have one of the lowest retention rates of any major religious tradition, with only 45% of those raised in the faith continuing to identify with it as adults. Young adults are particularly unlikely to stay with mainline churches – just 37% of Millennials who were raised in the mainline tradition still identify with mainline Protestantism.
The declines within mainline Protestantism have been seen across a variety of denominational families (including Methodists, Lutherans and Presbyterians) as well as within specific denominations. For example, the share of those who self-identify as part of the United Methodist Church (the largest single mainline denomination) has fallen from 5.1% of U.S. adults in 2007 to 3.6% in 2014.
As the U.S. grows more racially and ethnically diverse, mainline Protestants remain one of the most heavily white Christian traditions. The share of mainline Protestants who are non-Hispanic white has declined in recent years (from 91% in 2007 to 86% in 2014), but it is currently higher than the comparable shares for Catholics (59%) and evangelical Protestants (76%) as well as U.S. adults overall (66%).
Note: A new interactive tool allows users to explore more detailed data for specific families and denominations within mainline Protestantism and other traditions. Chapter 1 of the full report on America’s Changing Religious Landscape has details about how respondents were categorized into different Protestants traditions, including mainline Protestantism.