Generation X has a gripe with pulse takers, zeitgeist keepers and population counters. We keep squeezing them out of the frame.
This overlooked generation currently ranges in age from 34 to 49, which may be one reason they’re so often missing from stories about demographic, social and political change. They’re smack in the middle innings of life, which tend to be short on drama and scant of theme.
But there are other explanations that have nothing to do with their stage of the life cycle.
Gen Xers are bookended by two much larger generations – the Baby Boomers ahead and the Millennials behind – that are strikingly different from one another. And in most of the ways we take stock of generations – their racial and ethnic makeup; their political, social and religious values; their economic and educational circumstances; their technology usage – Gen Xers are a low-slung, straight-line bridge between two noisy behemoths.
The charts below tell the tale.
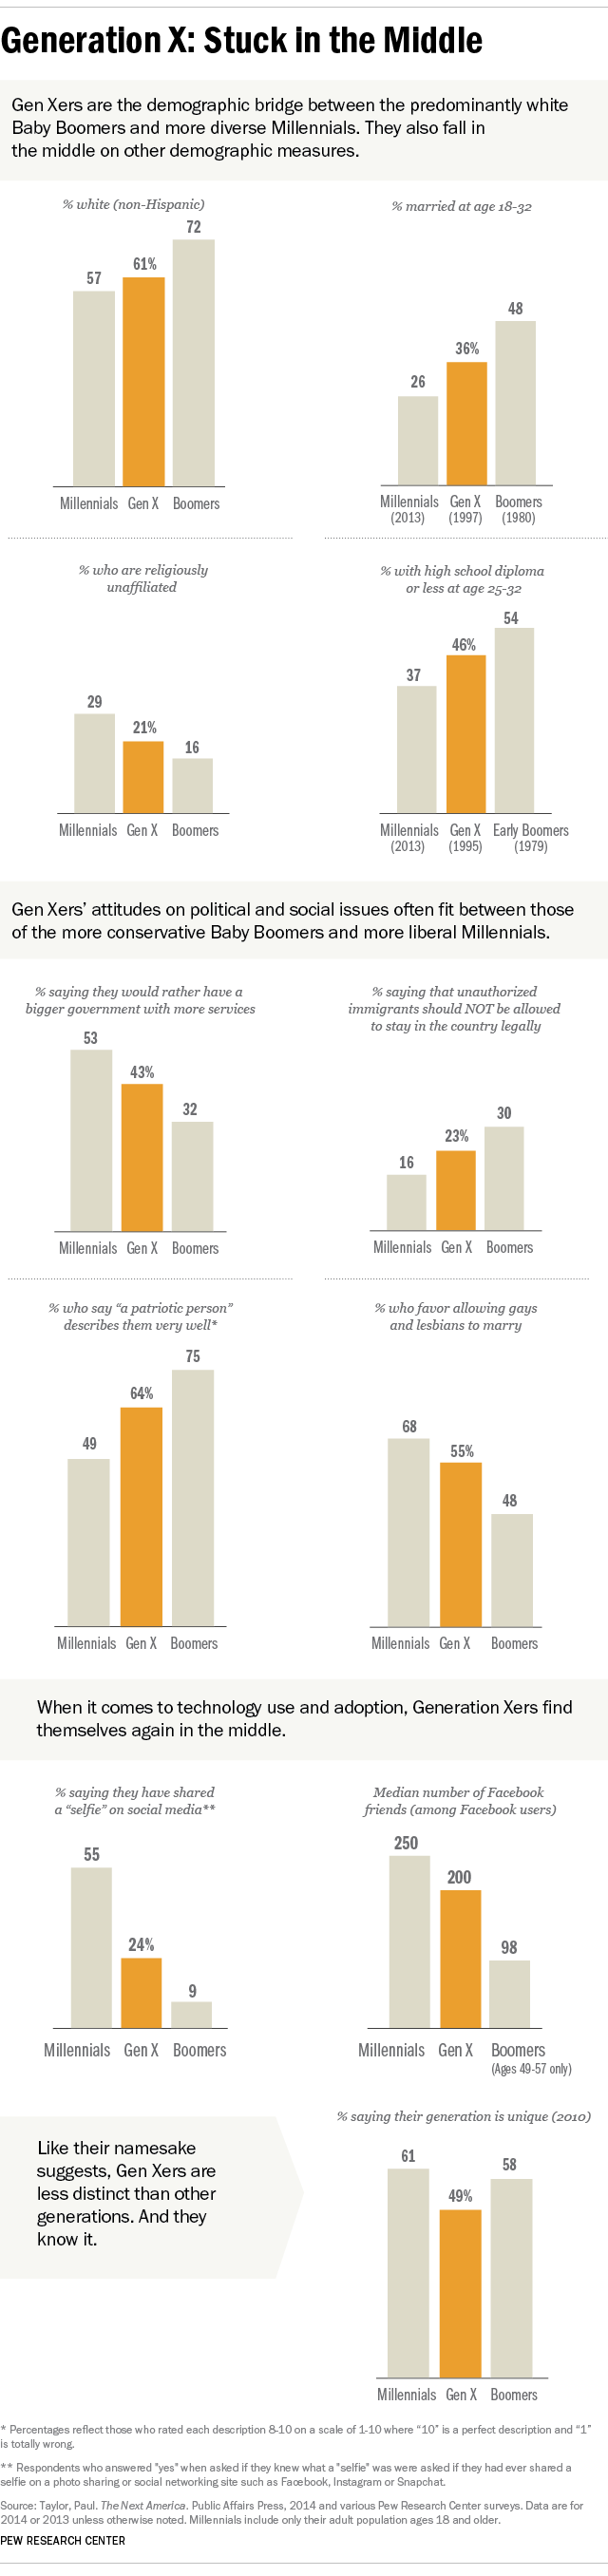
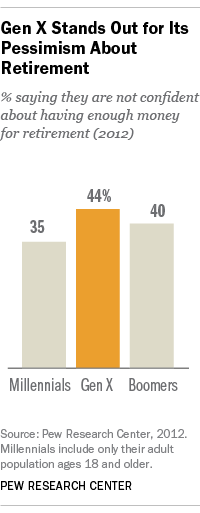
To be fair, there are a few metrics that don’t fit this straightforward pattern of generational evolution. For example, over the course of their voting lives, older Gen Xers have tended to be more Republican than both older Boomers and younger Millennials. Also, Xers are more pessimistic than both of those larger generations that they’ll have enough money for their retirement – though some of that negativity is doubtless tied to the economic stresses of middle age.
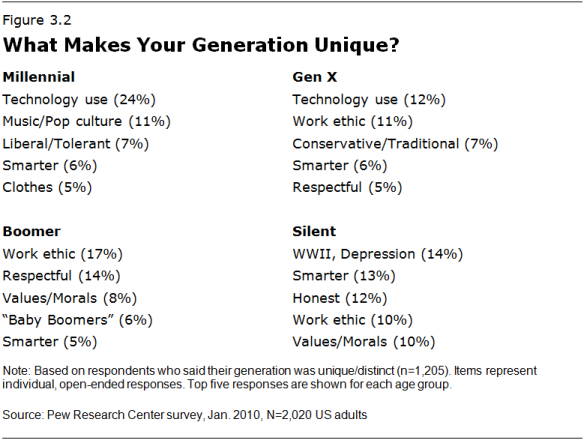
Gen Xers also stand out in another way. In 2010 when Pew Research asked adults of all ages if they thought their own generation was unique, about six-in-ten Boomers and Millennials said yes. But only about half of Gen Xers said the same. And even among those who did, there was very little consensus about why they are distinctive.
One reason Xers have trouble defining their own generational persona could be that they’ve rarely been doted on by the media. By contrast, Baby Boomers have been a source of media fascination from the get-go (witness their name). And Millennials, the “everybody-gets-a-trophy” generation, have been the subject of endless stories about their racial diversity, their political and social liberalism, their voracious technology use, and their grim economic circumstances.
Gen Xers have also gotten the short end of basic generational arithmetic. Due partly to their parents’ relatively low fertility rates, there are fewer of them (65 million) than Boomers (77 million) or Millennials (an estimated 83 million assuming a roughly 20-year age span and including those who have yet to reach adulthood).
But there’s another reason that Xers are a small generation: They’ve been deemed to span just 16 years, while most generations are credited with lasting for about 20 years. How come? No one really knows. Generational boundaries are fuzzy, arbitrary and culture-driven. Once fixed by the mysterious forces of the zeitgeist, they tend to firm up over time.
One final slight: Even their name is a retread. World War II photographer Robert Capa first coined the term Generation X in a photo essay about the young adults of the 1950s, but the label didn’t stick the first time around. It was revived thirty years later by Canadian author Douglas Coupland, whose coming of age novel, Generation X: Tales for an Accelerated Culture, was set in Southern California.
For Xers, there’s one silver lining in all this. From everything we know about them, they’re savvy, skeptical and self-reliant; they’re not into preening or pampering, and they just might not give much of a hoot what others think of them. Or whether others think of them at all.
Paul Taylor, executive vice president for special projects at the Pew Research Center, is the author of The Next America: Boomers, Millennials and the Looming Generational Showdown (Public Affairs, 2014). In other words, he’s part of the problem.